Buoy readings are one of the most useful reality checks in surf forecasting. Forecast models can tell you what should happen, but buoys tell you what is actually happening in the ocean right now. Once you know how to read swell height, period, direction, and spectral data, a buoy report becomes more than a string of numbers. It becomes a practical tool for timing swells, estimating surf size, and understanding why one beach is pumping while another nearby spot is flat. If you want to go deeper into the subject, a good surf forecasting book can help you build a strong foundation alongside the data you collect from buoys.
This guide walks through everything you need to understand buoy data and put it to use at your local breaks. Whether you surf a beachbreak that responds predictably to northwest swell or a fickle reef that only lights up under very specific conditions, learning to read buoy reports will help you spend less time guessing and more time in the water on the right days. It also pays to track conditions at the beach itself — a portable weather station can give you a quick read on wind, pressure, and temperature before you load the board on the car.
What Weather and Surf Forecasting Buoys Measure
A buoy is an ocean instrument platform that records conditions at sea and transmits data to shore by radio or satellite. For surfers, the most important buoy data usually comes from wave-measuring buoys placed offshore, but many weather buoys also provide useful surf information.
Weather buoys vs. surf forecasting buoys
Weather buoys are designed mainly for marine meteorology. They typically measure wind speed and direction, air pressure and pressure trend, air and water temperature, and wave height and period when wave sensors are installed.
Surf forecasting buoys, more accurately called wave buoys, focus on sea-state measurements. Directional wave buoys detect how the ocean surface moves both vertically and horizontally, allowing them to estimate swell height, period, and direction.
Some buoys are large, multi-purpose platforms. Others are small spherical devices — such as Datawell Waverider-style buoys — specifically designed to track wave motion. Both types are useful, but dedicated directional wave buoys generally provide the cleanest surf-relevant data.
Real buoys vs. virtual buoys
A real buoy is a physical instrument floating in the ocean. A virtual buoy is a model point that displays forecast data for a chosen location. Virtual buoys are useful for filling gaps in coverage, but they are not observations. When checking a swell, it is important to know whether you are looking at measured data or model output.
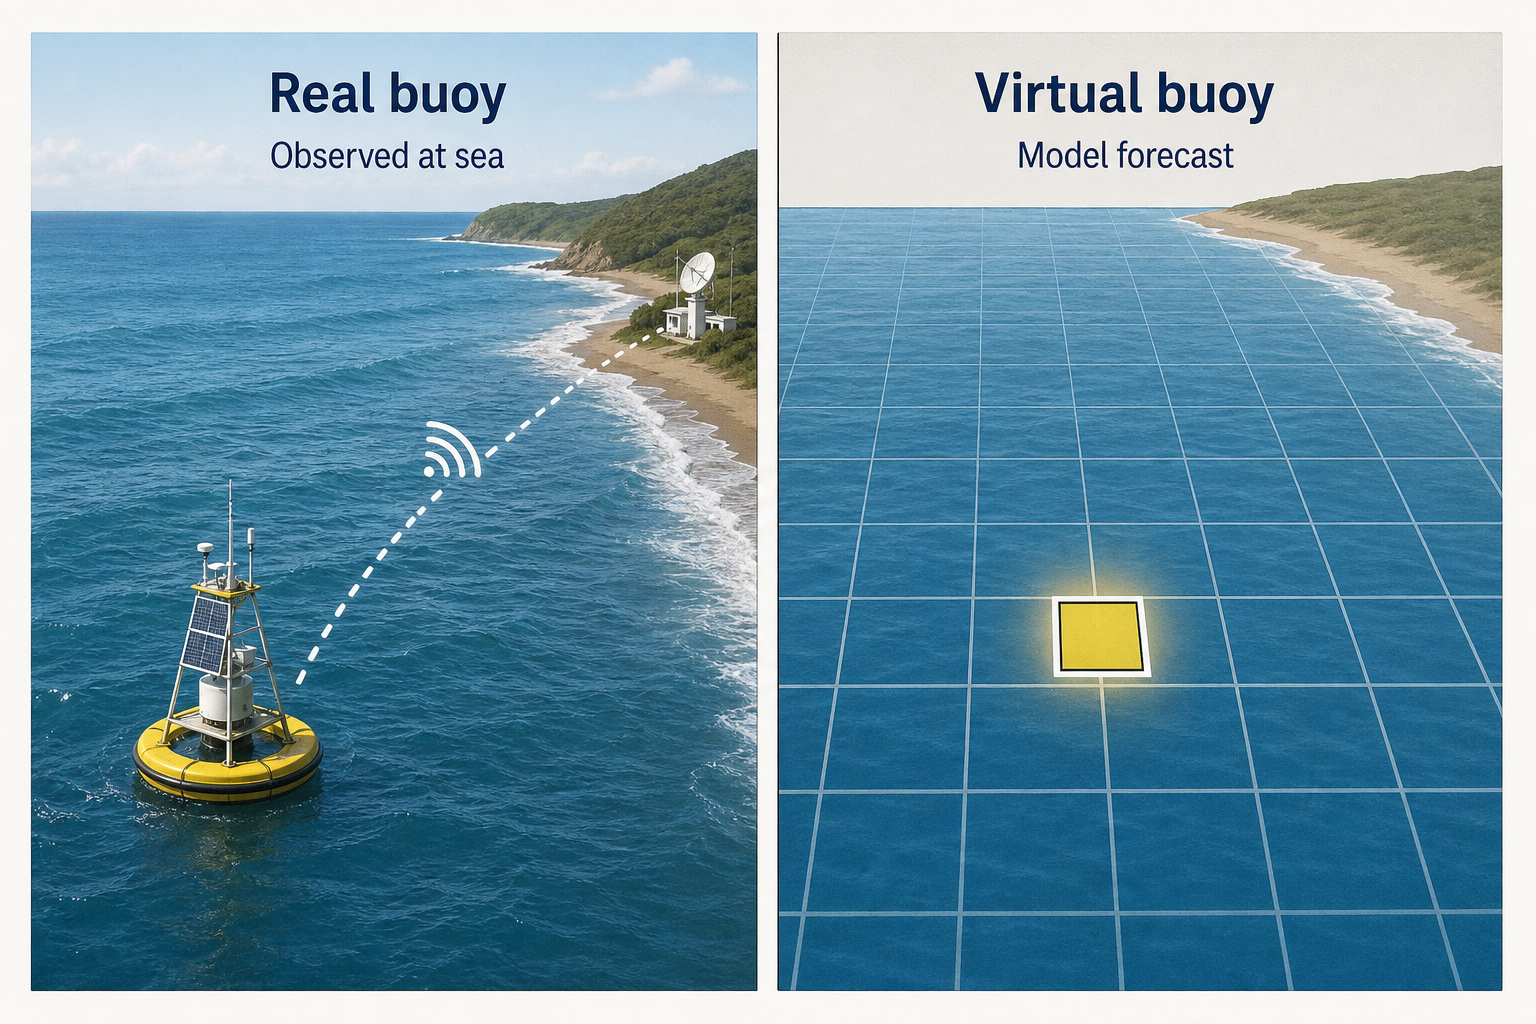
Real buoy readings help confirm or correct the forecast. Virtual buoys help where no physical buoy exists.
Why Buoy Readings Are Useful in Surf Forecasting
Buoy readings matter because they show what the ocean is actually doing rather than what a model thinks it will do. A surf forecast may call for a new swell to arrive at noon, but an offshore buoy can confirm whether the swell has already arrived, is running late, or is smaller than expected.
For surfers, buoy data is useful for several reasons:
- Timing swell arrivals: Offshore buoys can detect a new swell before it reaches the coast.
- Checking forecast accuracy: Buoys reveal whether a model is overcalling or undercalling a swell.
- Separating swell from local wind chop: Spectral data can show whether energy is coming from a clean groundswell or short-period windswell.
- Estimating surf size: Height, period, and direction together provide solid clues about breaking wave size.
- Understanding local differences: Comparing buoy readings with actual surf over time helps you learn how your local breaks respond.
The key point is that a buoy does not directly tell you the surf size at your beach. It tells you what the ocean is doing at the buoy’s location. Your job is to translate that offshore information into a useful local surf estimate.
Types of Buoys Used for Swell and Surf Forecasting
Deep-water directional wave buoys
Deep-water directional wave buoys are among the most valuable tools for surf forecasting. They are placed far enough offshore to measure incoming swell before it is significantly affected by shallow water, reefs, sandbars, or coastal headlands.
These buoys are especially useful for tracking groundswell. A deep-water buoy may show a long-period swell several hours before it reaches the beach, giving you time to plan your session accordingly.
Nearshore wave buoys
Nearshore buoys are positioned closer to the coast. Their readings often reflect waves that have already been modified by local bathymetry and coastal sheltering, which can be a good or bad thing depending on your goal. A nearshore buoy may be more representative of conditions at nearby surf zones, but it provides less advance warning and may not represent beaches farther down the coast.
Multi-purpose weather buoys
Large marine weather buoys can provide valuable wave data, especially when positioned in exposed waters. However, not all weather buoys have high-quality directional wave sensors. Some report only significant wave height and dominant period. They are still useful, particularly when combined with nearby wind observations. Keeping a marine barometer at home can help you track pressure trends that complement what you see on a buoy report.
Harbor and sheltered buoys
Buoys inside bays, ports, or channels are usually poor indicators of open-ocean swell. They may be useful for local wind or water temperature readings, but their wave data is often reduced by sheltering. If a buoy sits behind an island, inside a harbor, or deep within a bay, do not treat it as a reliable swell indicator.
Drifting buoys and research floats
Drifting buoys and oceanographic floats collect valuable scientific data, but they are not practical for day-to-day surf forecasting. Because they move with ocean currents, they are not fixed reference points for tracking incoming swell.
Tsunami buoys
Deep-ocean tsunami detection systems use pressure sensors on the seafloor to detect long-wavelength tsunami signals. They are not designed for surf forecasting and do not provide the kind of wave data surfers need.
Where to Find Buoy Readings Online
Buoy availability varies by country and coastline. In some regions, public buoy networks are extensive. In others, readings may be limited or accessible mainly through commercial forecast services.
Major buoy data resources
| Region | Useful resources | Notes |
|---|---|---|
| United States | NOAA National Data Buoy Center, Coastal Data Information Program | Excellent real-time buoy coverage, especially for Hawaii, California, and the East Coast. |
| Hawaii and Pacific Islands | NOAA, PacIOOS, Coastal Data Information Program | Very useful for tracking long-period Pacific swell. |
| Canada | Environment and Climate Change Canada marine buoys | Good data for exposed Pacific and Atlantic waters. |
| United Kingdom and Ireland | Channel Coastal Observatory, Met Office marine observations, Marine Institute Ireland | Useful for Atlantic swell and local wind-sea readings. |
| Europe | Puertos del Estado, CANDHIS, IPMA, Copernicus Marine | Coverage varies by country, with strong networks in Spain, France, and Portugal. |
| Australia | Bureau of Meteorology, state wave buoy networks, Manly Hydraulics Laboratory | State agencies often provide the best nearshore buoy data. |
| New Zealand | MetService, regional council wave buoys | Useful but region-dependent. |
| Japan and East Asia | NOWPHAS, national meteorological and ocean agencies | Good technical data, though some portals are less beginner-friendly. |
| Global | Windy, Surfline, Stormsurf, national marine agencies | Some sites combine real buoy data with forecast model output. |
When using third-party surf or weather sites, always check whether the displayed buoy reading is observed data or a model estimate. The difference matters, especially when a swell is building or changing quickly. Staying on top of weather alerts is also worthwhile — a NOAA weather radio can keep you informed of rapidly developing marine conditions even when you are away from a screen.
How to Understand Buoy Readings for Surf Forecasting
Significant wave height
The main wave-height number on a buoy report is usually significant wave height, often labeled WVHT, Hs, or Hm0. It represents roughly the average height of the highest one-third of waves recorded during a sampling period. It is not the height of every wave offshore, and it is not the exact breaking wave face you will see at the beach.
For example, a buoy reading of 4 feet does not mean every wave is 4 feet tall. Some waves will be smaller, and occasional waves may be much larger. In an energetic sea state, the largest individual waves can be roughly 1.5 to 2 times the significant wave height.
Dominant period and peak period
Wave period is the time in seconds between passing wave crests. It is one of the most important numbers in surf forecasting because it directly affects how much energy a swell carries and how it behaves as it enters shallow water.
Common period terms include:
- Dominant period: The period associated with the most wave energy in the measured sea state.
- Peak period: Similar to dominant period, typically used to describe the highest-energy part of the wave spectrum.
- Average period: The average across all measured waves, including shorter chop.
A 3-foot swell at 16 seconds will produce far more powerful surf than a 3-foot swell at 8 seconds. Long-period waves have longer wavelengths, travel faster in deep water, and feel the seafloor sooner as they approach the coast. In deep water, wavelength in meters is approximately:
Wavelength ≈ 1.56 × period²
A 10-second swell has a deep-water wavelength of about 156 meters. A 16-second swell has a wavelength of about 399 meters. This is why long-period groundswell can refract around points, wrap into bays, and steepen quickly over shallow reefs.
Swell direction
Swell direction tells you where the waves are coming from. A reading of 270 degrees means the swell is coming from the west and traveling east. A reading of 180 degrees means it is coming from the south and traveling north. This follows the same convention used for wind direction, and it matters because each beach only receives swell that falls within its swell window.
A west-facing beach may be fully exposed to swell from 270 degrees but receive very little energy from 310 degrees if a headland blocks the northwest approach. A nearby beach facing southwest may respond completely differently to the exact same buoy reading.
Spectral data
Spectral data is where buoy readings become especially powerful. Instead of showing one combined height and period, a spectrum shows how wave energy is distributed across a range of periods and directions.
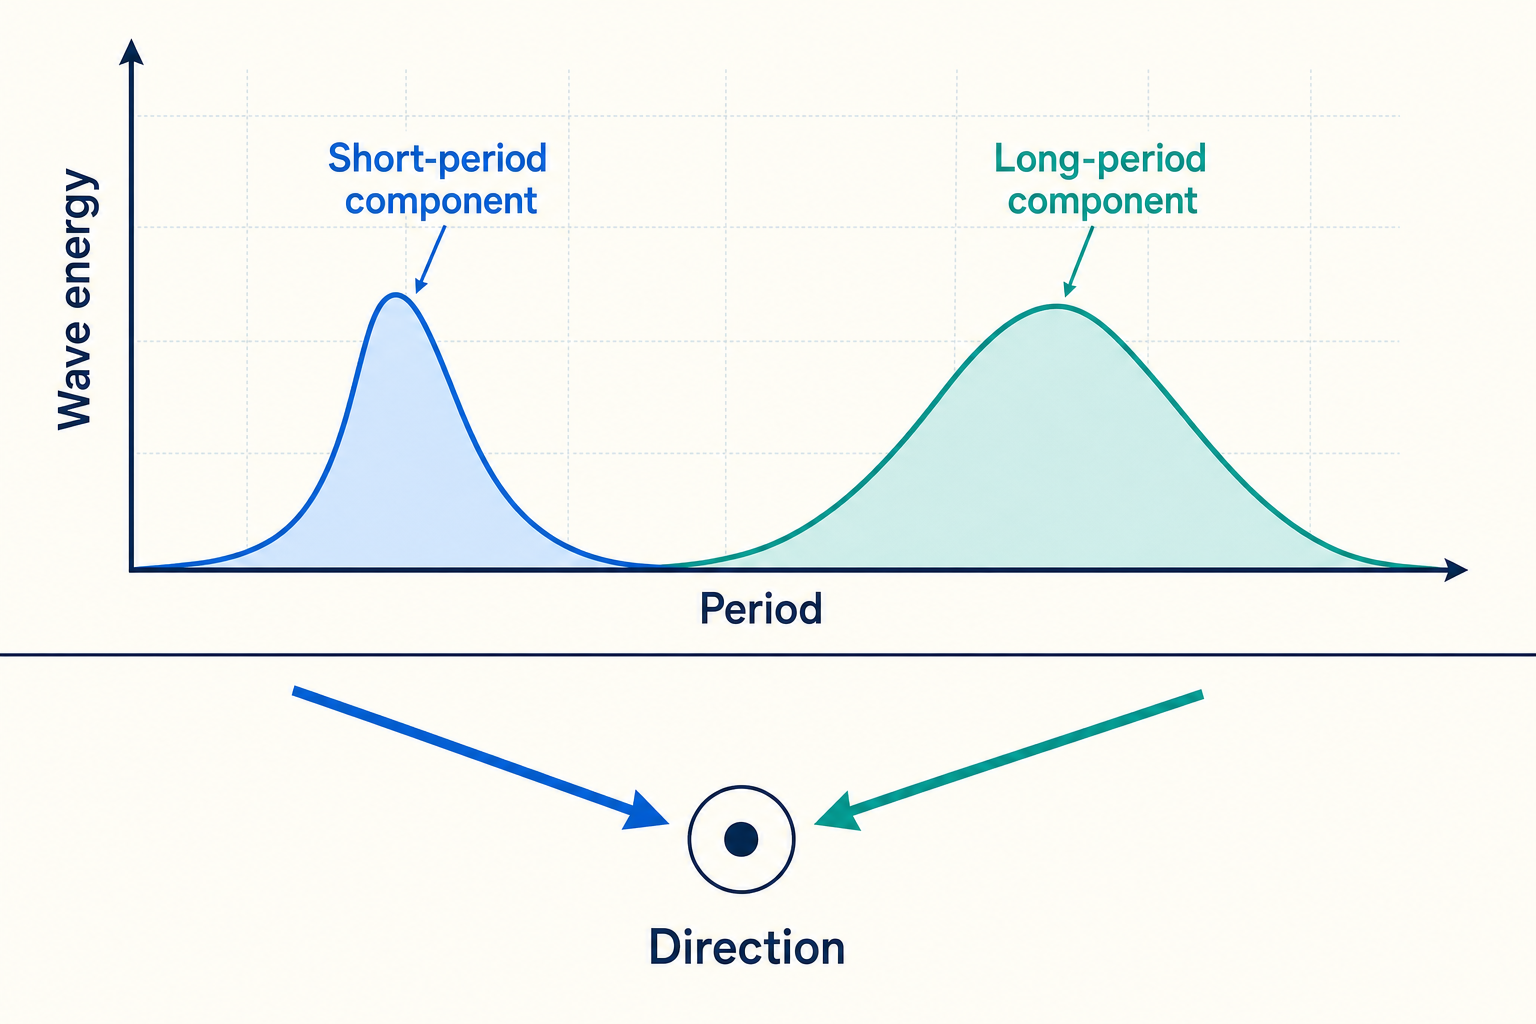
A simple buoy summary might read:
6 feet at 9 seconds from 300 degrees
But the underlying spectrum might reveal two separate swells:
- 4 feet at 15 seconds from 280 degrees
- 4 feet at 8 seconds from 320 degrees
Those two energy sources would produce very different surf. The 15-second swell may generate powerful set waves at exposed breaks, while the 8-second swell may be local windswell producing weaker, less organized surf. Technically, a wave spectrum shows energy density by frequency or period, and the area under the spectral curve is used to calculate spectral significant wave height, known as Hm0. Directional spectra also show where each band of energy is coming from.
Swell partitions
Some buoy networks and surf forecast sites simplify spectral data into swell partitions — components such as primary swell, secondary swell, and wind wave. Partitions are extremely useful when the ocean is mixed. If the total sea state is 7 feet but most of that energy is short-period wind chop, the actual surf may be much smaller than the headline number suggests. If a smaller long-period swell is buried beneath the wind sea, certain reefs or points may still be surfable while nearby beachbreaks are messy.
Wind readings
Buoy wind readings help explain local sea texture and short-period wave growth. Offshore buoys can also indicate whether nearby windswell is being generated. Wind direction is reported as the direction the wind is coming from, so a west wind blows from west to east. Whether that wind is offshore or onshore depends entirely on the orientation of the coastline you are surfing. If you want to measure local wind conditions yourself, a handheld anemometer is a handy tool to bring to the beach.
Pressure, temperature, and other readings
Air pressure can help identify passing fronts and storm systems. Water temperature is useful for knowing what wetsuit to wear. Some buoys also report gusts, dew point, and visibility. These readings are secondary when it comes to estimating surf size, but they help complete the weather picture around the buoy.
Timestamps, units, and quality flags
Always check the timestamp on a buoy report. A reading that is three hours old can be misleading during a fast-rising swell. Also check units — most official buoy networks report wave height in meters, while surf sites often convert to feet. Quality flags matter too. Buoys can malfunction, drift off station, or report incomplete data. If a reading looks suspect, compare it with nearby buoys and forecast charts before relying on it.
How to Estimate Wave Size From Offshore Buoy Readings
Estimating surf size from a buoy is part science and part local pattern recognition. There is no universal conversion because each beach transforms swell differently. That said, a reliable step-by-step approach can get you close.
Step 1: Choose the right buoy for the swell
The best buoy is usually one that is offshore, exposed to the incoming swell, and not blocked by land. It should also be positioned “upstream” from your coast relative to the swell direction you are tracking. If a south swell is moving north, a buoy south of your beach may give advance notice. A buoy north of your beach may not show the swell until after it has already passed your area.
Step 2: Use the relevant swell partition
Do not rely only on total wave height. Look for the swell component that actually matters to your beach. If the buoy reports 8 feet at 7 seconds from the northwest and 2 feet at 17 seconds from the southwest, a southwest-facing reef may respond more to the smaller long-period swell than the larger but weaker short-period wind sea.
Step 3: Check the beach’s swell window
Compare swell direction with the exposure angle of the break. A beach facing west will generally receive west swell better than south swell, but the real swell window is also shaped by islands, headlands, and offshore banks. A difference of just 10 to 20 degrees can matter enormously at some breaks and barely at all at open beachbreaks.
Step 4: Account for period
Period changes everything. Long-period swell shoals more strongly, refracts more dramatically, and can focus energy into specific breaks in ways that short-period swell cannot. A rough guide to period categories:
| Period | Typical surf meaning |
|---|---|
| 5–8 seconds | Short-period windswell, usually weaker and less organized. |
| 9–11 seconds | Mid-period swell, often rideable and either locally generated or regional. |
| 12–14 seconds | Solid groundswell with more energy and better organization. |
| 15–20+ seconds | Long-period groundswell, often powerful and highly influenced by bathymetry. |
Step 5: Estimate arrival time
Deep-water swell energy travels at group velocity. A practical shortcut for surfers is:
Swell travel speed in knots ≈ 1.5 × period in seconds
So a 16-second swell travels at roughly 24 knots. If an offshore buoy is 120 nautical miles from your beach, the swell energy will take approximately five hours to arrive:
120 ÷ 24 = 5 hours
This is an estimate. Directional angle, changing period, and coastal refraction can all affect the exact timing.
Step 6: Convert buoy height into likely surf height
A common beginner mistake is treating buoy height as surf height. Sometimes they are close. Often they are not. Breaking surf size depends on offshore swell height, swell period and direction, local bathymetry, and the state of the tide and sandbars.
As a rough starting point for an exposed beach with a good swell angle:
| Offshore swell reading | Possible surf at exposed breaks |
|---|---|
| 2 ft at 8 seconds | Small, weak surf; often knee to waist high. |
| 2 ft at 14 seconds | Noticeably more push; often waist to chest high. |
| 4 ft at 10 seconds | Fun mid-size surf; often chest to head high. |
| 4 ft at 16 seconds | Solid surf; often head high to overhead. |
| 6 ft at 16 seconds | Large surf at exposed breaks; potentially much bigger at focused reefs. |
These are not universal rules. Some beaches underperform on long-period swell because the energy refracts away before it arrives. Some reefs amplify the same swell into surf far larger than the buoy number would suggest.
A practical local formula to keep in mind:
Estimated surf face height = buoy swell height × exposure factor × period-and-bathymetry factor
The exposure factor accounts for swell direction and shadowing. The period-and-bathymetry factor reflects how your local seafloor converts offshore energy into breaking waves. The only way to refine those factors is to compare buoy readings with actual surf conditions over time. Keeping a surf journal is one of the best ways to build that local knowledge systematically.
Example buoy forecast
Imagine an offshore buoy 90 nautical miles away reports:
- 4 feet at 15 seconds from 285 degrees
- Wind wave: 3 feet at 7 seconds from 320 degrees
Your beach faces west and works best from 270 to 295 degrees. The 15-second swell sits squarely inside the swell window, so that is the reading to focus on. At a travel speed of roughly 22.5 knots, the swell should arrive in about four hours. At an exposed sandbar, that might produce head-high to slightly overhead sets. At a focused reef, it could be larger. At a beach partly shadowed from 285 degrees, it may be smaller.
Why Buoy Readings May Not Match the Surf at a Specific Beach
Swell shadowing
Land blocks swell. Islands, capes, and outer reefs can strip away a significant amount of wave energy before it reaches a beach. A buoy may show a strong swell offshore while a protected beach stays small. This is especially common in regions with complex coastlines, where two breaks only a few miles apart can receive completely different surf from the same swell event.
Local bathymetry
The seafloor controls how swell bends, focuses, and breaks. Submarine canyons can steer energy away from one beach and concentrate it onto another. Reefs and offshore banks can amplify certain periods and directions. This is one reason long-period swell produces such variable results — a 17-second swell may light up one point and barely affect a nearby beachbreak at all.
Tide and sandbars
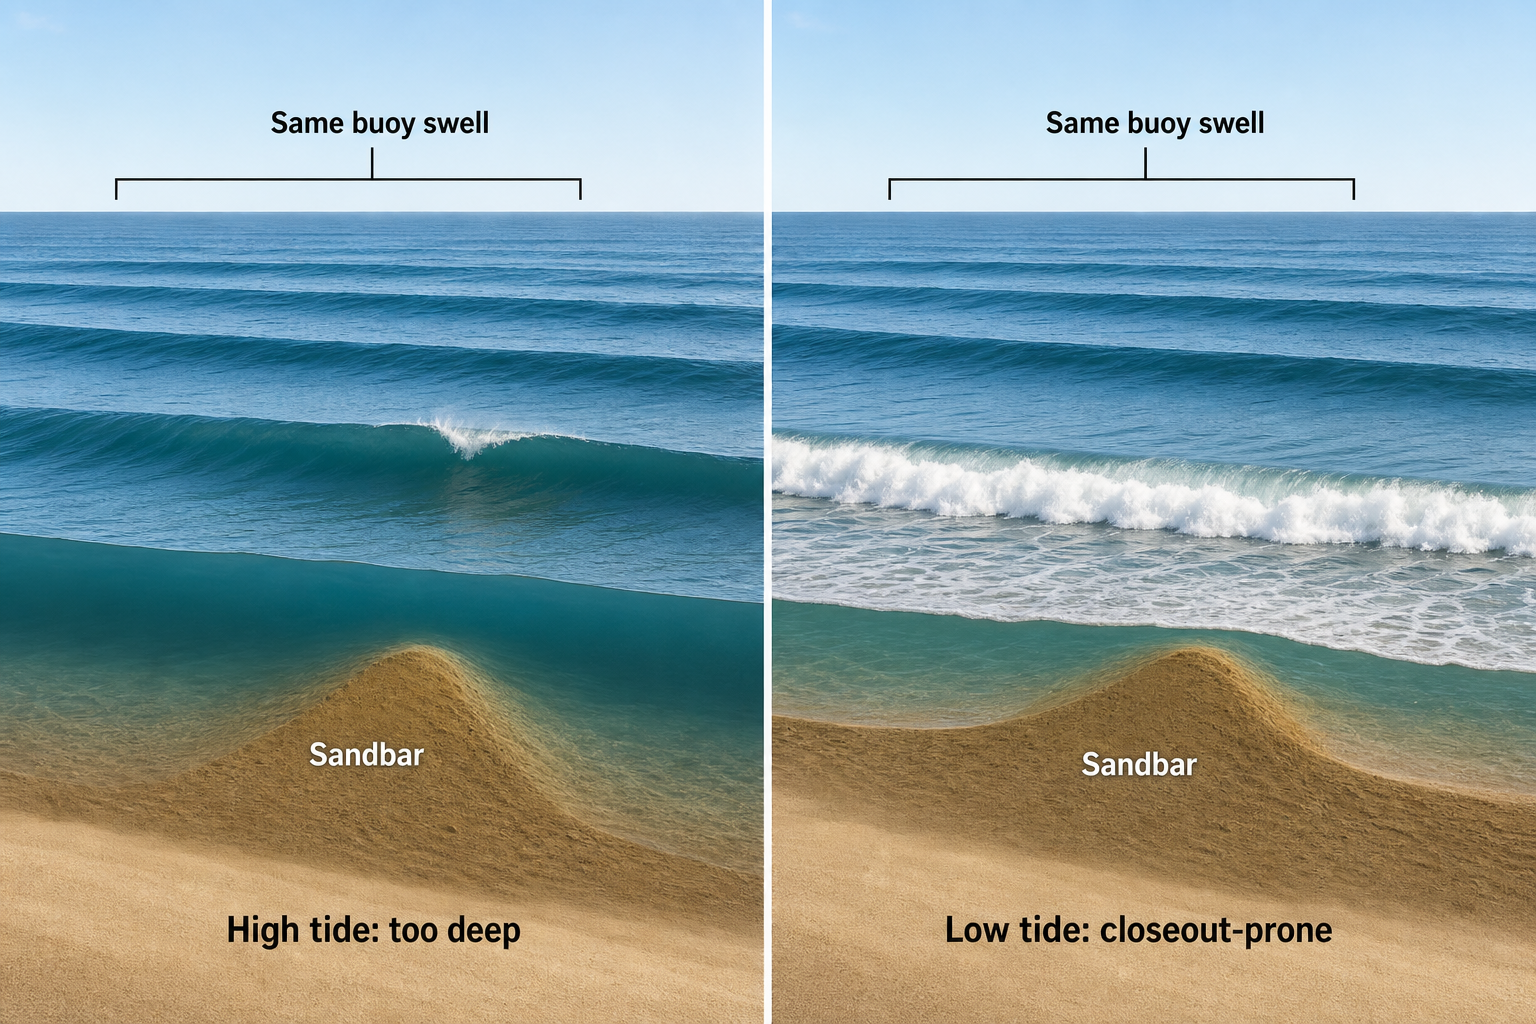
Buoys have no way of knowing the state of your local sandbar. A buoy may show solid swell while the beach sits too deep at high tide or too shallow and closeout-prone at low tide. Seasonal sand movement also changes how a spot responds to the same buoy reading from month to month. Tracking tide cycles is part of reading the full picture, and a tide clock on the wall at home is a simple way to stay on top of the daily cycle.
Local wind
An offshore buoy might report clean swell while local onshore wind at the beach ruins surface conditions. The opposite can happen too — a buoy in exposed, windy waters may show a messy sea state while a sheltered section of coastline nearby is clean and organized.
Multiple swells
Mixed swell can make the headline buoy number misleading. A beach may receive one swell direction and reject another based on its exposure angle. If you only look at total significant wave height, you can easily overestimate or underestimate the actual surf that a specific break will see.
Buoy location and water depth
A buoy in deep water reads swell before it has been transformed by coastal bathymetry. A buoy in shallower water may already reflect some refraction and shoaling. A buoy too far from your region may miss locally generated wind waves, while a buoy too close to shore may provide little advance warning of incoming swell.
Timing differences
Swell arrives in bands. The longest-period energy typically arrives first, followed by progressively shorter periods. A buoy might show the forerunners of a swell well before the main energy fills in at the beach. This is why a new long-period reading does not immediately mean strong surf — early arrivals can be inconsistent, with long waits between sets and gradual build over several hours.
Measurement limits and data errors
Buoys operate in a harsh environment. Moorings stretch, sensors degrade, and transmissions fail. A single unusual reading should be treated with caution unless nearby buoys confirm it. Cross-referencing multiple sources is always a good habit.
Building a Local Buoy Reading Method
The best surf forecasters do not just memorize buoy definitions. They build a personal relationship between buoy readings and surf outcomes at specific breaks over time.
Start by identifying a few reliable buoys near your coast. For each surf session, take note of the relevant swell height, period, and direction, the tide and local wind, the actual surf size and consistency, and which spots overperformed or underperformed relative to the buoy reading. A waterproof notebook is perfect for logging conditions at the beach without worrying about saltwater damage.
Over time, clear patterns emerge. You might learn that your local break needs at least 3 feet at 12 seconds from 260 degrees to be worth surfing. You may discover that 18-second swell closes out the beachbreak but makes a nearby point exceptional. Documenting these observations consistently is what separates a surfer who forecasts accurately from one who still shows up to flat or terrible conditions.
Some surfers also like to get a visual read from the cliff or parking lot before paddling out. A pair of compact binoculars lets you check wave size and set frequency from a distance and compare what you see against what the buoy reported. If you want to document sessions and study wave behavior over time, mounting an action camera on a cliff or tripod can give you footage worth reviewing later — just make sure you have a reliable microSD card with enough capacity to store it all.
For surfers who explore new coastlines and unfamiliar breaks, a handheld GPS helps you mark promising spots and track where you are relative to known buoy positions. A basic orienteering compass is similarly useful when working with nautical charts to understand swell exposure angles. Speaking of which, learning to read a nautical chart will help you understand how the underwater topography around a break shapes the swell that reaches it — knowledge that makes your buoy interpretations far more accurate. And if you are checking buoy data on your phone at the beach or in the water, a waterproof phone pouch keeps your device protected while you stay connected to live data.
Buoy readings are not a magic answer, but they are one of the most dependable tools available in surf forecasting. By understanding what each number means and how offshore swell transforms as it approaches your coast, you can move past guessing and start making informed calls about when and where to surf. The real skill comes from combining measured buoy data with swell windows, bathymetry knowledge, and local experience until those numbers begin to accurately describe the waves you will see from the sand.