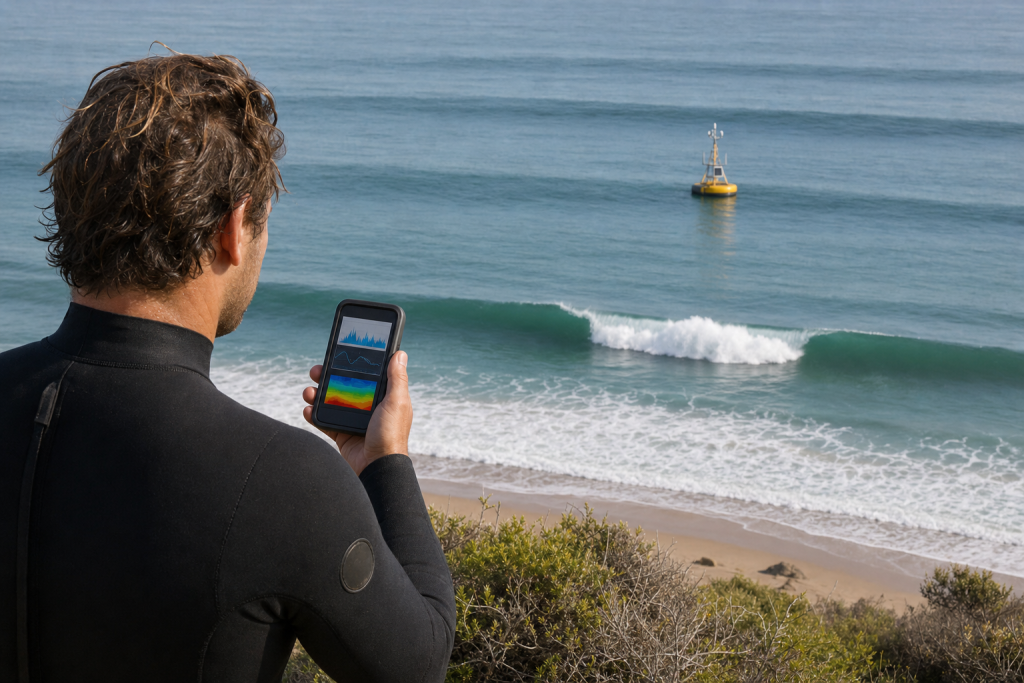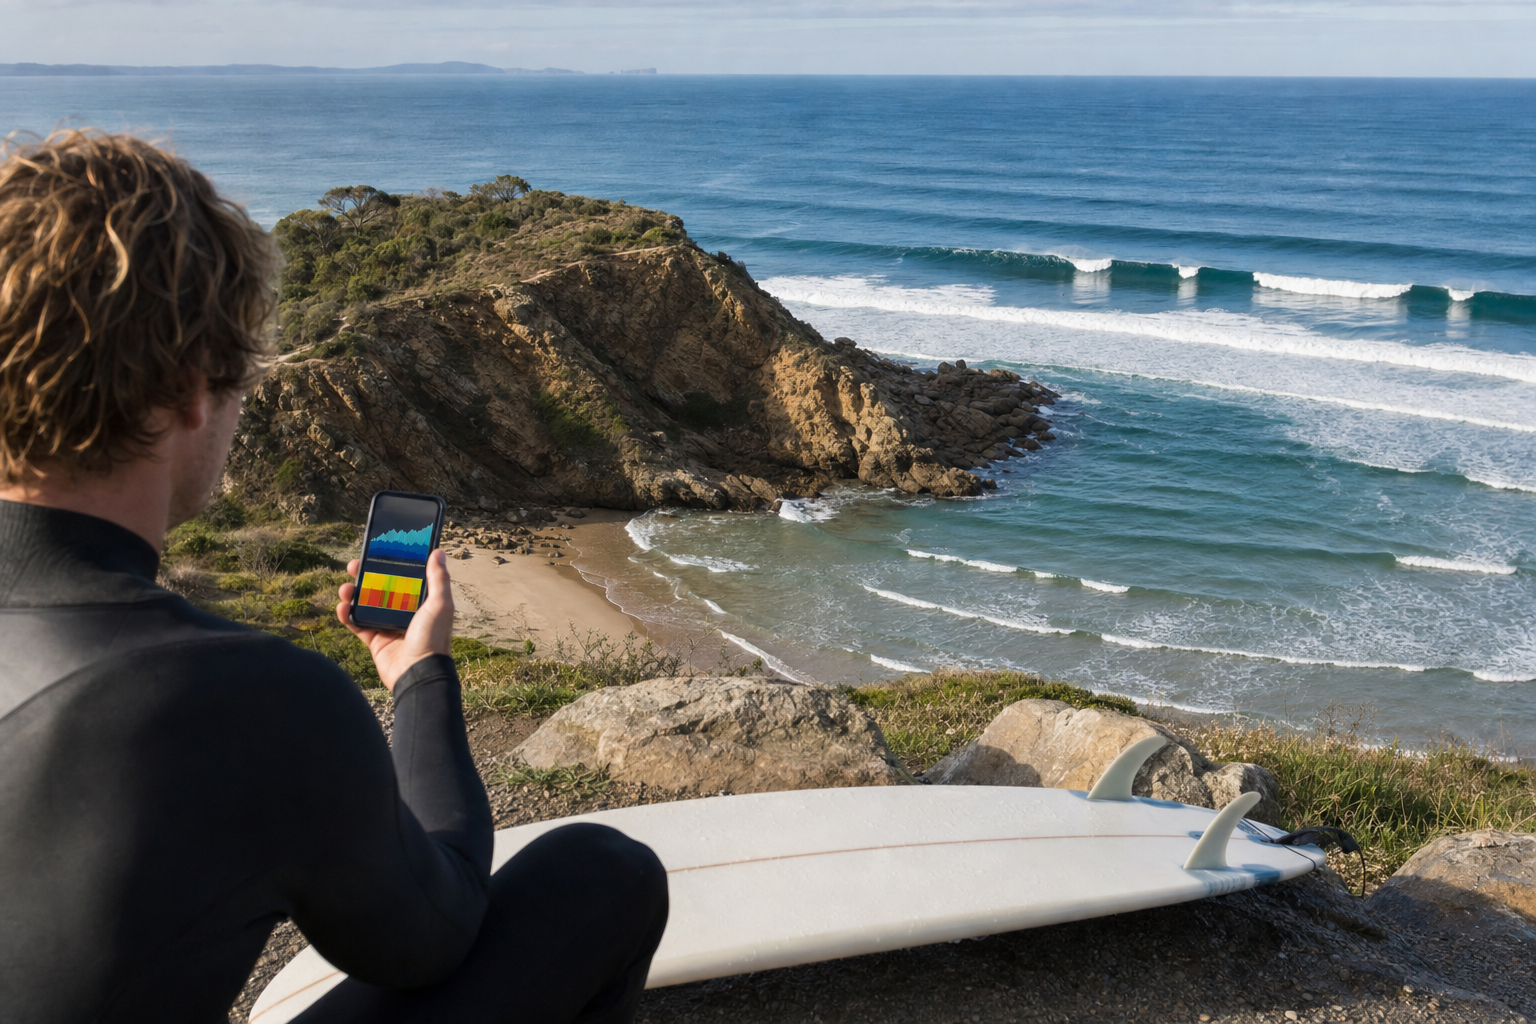
Surf forecasts are remarkably useful, but every surfer eventually learns a humbling truth: a forecast that looks perfect on a screen can turn into weak knee-high surf, and a “small” day can arrive with surprisingly solid sets. The problem is not always a bad forecast. Most online surf forecasts start with broad ocean data, then estimate what that energy might become at a beach, reef, point, or jetty. Between deep water and the lineup, local geography and seafloor shape can dramatically change the result. If you want to go deeper on how all of this works, this surf forecasting book is a solid read that covers swell mechanics and our broader connection to the sea. Understanding why surf forecasts get it wrong helps you read them more intelligently, choose better spots, and build your own mental model of how a break really works.
Why Surf Forecasts Get It Wrong at Specific Spots
A surf forecast is usually built from three layers of information: offshore swell predictions, local wind predictions, and spot-specific calculations. The offshore part may be very accurate while the final spot forecast is still wrong, because waves do not travel into every coastline equally. Keeping a close eye on tide timing is one way to sharpen your read on local conditions, and a simple tide clock for the wall makes it easy to track the tidal cycle at a glance without checking your phone every few minutes.
Most forecasting models estimate swell in relatively large grid squares. Depending on the model, one grid point may represent an area several kilometers wide or much larger offshore. That is fine for regional swell trends, but it cannot fully represent a small reef pass, a hidden sandbar, or a headland that blocks a few critical degrees of swell direction.
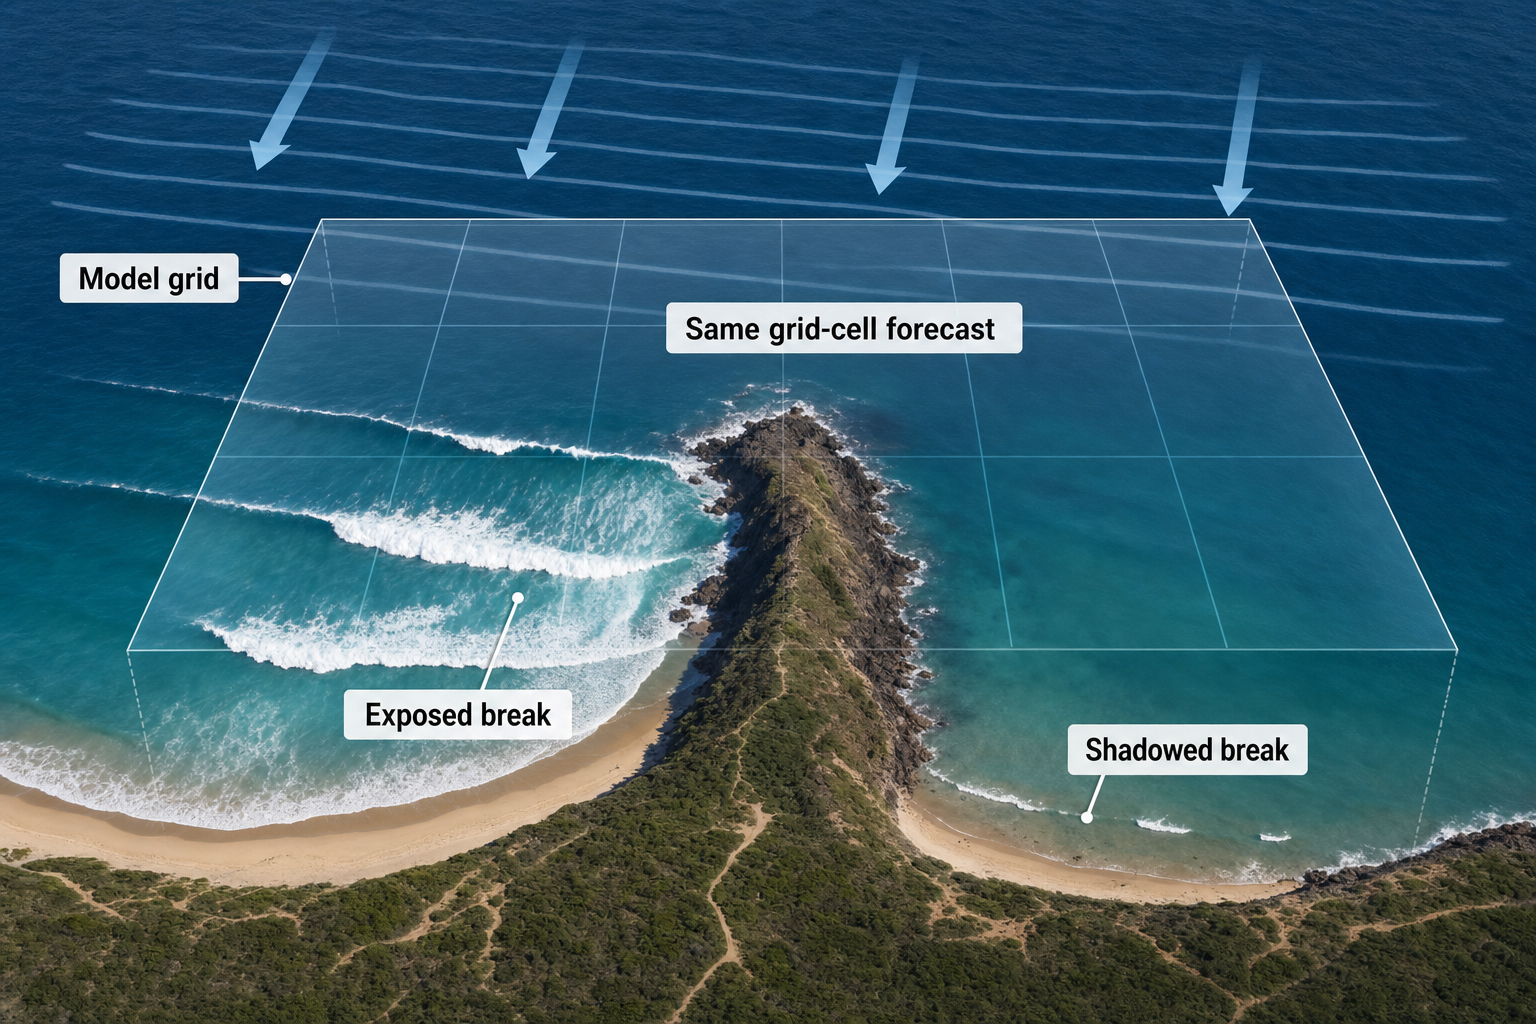
That is why two breaks only a mile apart can be completely different. One may face directly into a south swell and double in size over a shallow reef. The other may sit behind a point and receive only refracted leftovers. A regional forecast might say “4 feet at 14 seconds,” but the real question is how much of that swell can actually reach the specific takeoff zone.
How Geography Changes Surf Forecast Accuracy
Geography determines whether a surf spot is exposed, sheltered, or selectively open to certain swell directions. Forecast models often struggle when a spot’s exposure depends on narrow directional windows or complex coastline shapes.
Swell Exposure and Swell Windows
Every surf spot has a swell window: the range of swell directions that can reach it without being blocked by land. An exposed west-facing beach may receive a broad range of west and northwest swell. A tucked-away cove may only work when the swell angle threads between islands or bends around a point.
If a forecast model slightly misreads swell direction, the difference may not matter much at an open beach. At a highly directional spot, a 10-degree error can be the difference between head-high surf and almost nothing.
This is one of the most common reasons forecasts are wrong. The model may correctly predict the swell in deep water, but the surf spot is partly shadowed. Forecasts can also overcall exposed spots when the swell direction is technically in the window but too oblique to send much energy into the lineup.
Islands, Headlands, and Coastal Shadowing
Land blocks swell. That sounds simple, but the details are often subtle. Islands, capes, and curved coastlines can create shadow zones where swell energy is reduced. A forecast may show a strong swell arriving in the region, but if that swell approaches from behind an island or headland, a protected spot may be much smaller than expected.
Shadowing is especially important in places with offshore islands, irregular coastlines, or deeply indented bays. Southern California, parts of Indonesia, and many Pacific island chains all have spots where swell direction matters as much as swell height.
Refraction Around Points and Reefs
Waves bend as they move into shallower water. This process, called refraction, can either focus swell energy or spread it out. Around points and reefs, refraction may turn a swell into a peeling wave, but it can also bend energy away from a beach.
Some point breaks need swell to approach at the correct angle so the waves wrap down the line. Too straight, and the surf may close out or miss the point entirely. Too angled, and the wave may be smaller but better shaped. Forecast models can estimate refraction, but local details are often too fine for broad-scale models to capture accurately.
How Bathymetry Can Magnify or Reduce Surf Size
Bathymetry refers to the underwater shape of the seafloor, and it is one of the biggest reasons surf forecasts get it wrong. The same offshore swell can become weak, powerful, hollow, or barely rideable depending on what it encounters underwater. Understanding the basic principles of how underwater terrain shapes waves is similar to learning to read a nautical chart — if that kind of technical mapping interests you, this guide to reading nautical charts explains how to interpret depth contours and coastal features in a clear, practical way.
Shoaling: Why Waves Grow in Shallow Water
As swell moves from deep water into shallower water, it slows down and steepens. This process is called shoaling. Longer-period swells feel the bottom in deeper water, so they begin transforming farther offshore. That is why a long-period swell can arrive with much more power than its wave height alone suggests.
A forecast showing 3 feet at 18 seconds may produce much larger surf than 3 feet at 9 seconds, especially at a reef or beach with good exposure. If a model or app emphasizes height without making period obvious, surfers may seriously underestimate an incoming swell.
Focusing by Canyons, Reefs, and Underwater Ridges
Some seafloor features concentrate wave energy. Submarine canyons, offshore ridges, and reef platforms can bend swell lines toward a specific takeoff zone, causing those spots to break bigger than nearby beaches and often getting undercalled by generic forecasts.
Because waves travel faster in deeper water and slower in shallow water, uneven bottom topography can bend swell energy into a focused peak. This can turn an average regional swell into a standout session at one particular spot while the beach a mile away barely shows any improvement.
Energy Loss Over Shelves and Wide Sandbars
Bathymetry can also reduce surf size. A broad continental shelf, outer sandbar, or shallow lagoon can drain energy before waves reach the main break. Long-period swells may break far outside, reform, then arrive smaller and weaker on the inside.
Some beaches look exposed on a map but consistently come in smaller than forecast because offshore bathymetry spreads or dissipates the swell. Others may show plenty of whitewater but lack clean, rideable faces because the energy breaks across too much shallow water at once.
Sandbars and Seasonal Bottom Changes
Beach breaks are especially hard to forecast because their bathymetry changes. Storms, currents, river mouths, and seasonal sand movement can create or destroy banks quickly. A model may know the swell and wind, but it usually does not know that last week’s storm carved a new channel or flattened the inside bar.
This is why beach-break forecasts can be accurate about size but wrong about quality. The report may call for chest-high surf, and the height may be correct, but the waves may close out because the banks are straight. A month later, the same forecast could produce excellent peaks at the same spot.
Why Some Surf Spots Are Underestimated by Forecasting Models
Some surf spots are regularly bigger than the forecast. Once you identify the pattern, those seemingly “wrong” forecasts become opportunities.
Long-Period Swell Magnets
Spots exposed to long-period swell often outperform the numbers. Deepwater reefs, outer points, and beaches near focusing bathymetry can pull in swell that nearby spots barely register. If a spot is known as a swell magnet, a forecast of modest deepwater height with a long period may be enough to produce strong surf.
Forecasts may underestimate these spots because their algorithms smooth out local focusing effects. The model sees the region, but the reef responds to the exact angle, period, and underwater contour that concentrates the swell.
Narrow Swell Windows That Models Smooth Over
Sometimes a break is underestimated because the model assumes partial shadowing, but the swell direction is perfectly aimed through the spot’s window. This happens most often at breaks that need a very specific direction. When the swell lines up correctly, the spot may be much larger than the regional call suggests.
For these locations, exact swell direction is critical. A forecast of 210 degrees may produce mediocre surf, while 195 degrees may be excellent — even if the swell height and period are identical.
Local Knowledge Not Built Into the Algorithm
Many surf forecast platforms apply corrections based on historical performance, but no model has perfect local knowledge. A spot may have a new sandbar, changed reef access, or a seasonal current pattern that makes it better than the forecast suggests. Human reports, surf cams, and your own notes are valuable because they capture details that numerical models frequently miss.
Why Some Surf Spots Are Overestimated by Forecasting Models
Other spots frequently look better online than they are in the water. These breaks are often exposed on paper but limited by direction, wind, tide, or bathymetry.
Blocked or Partially Shadowed Swell
A model may show a strong regional swell and assign a generous size to a nearby spot, but land shadowing can reduce the actual surf significantly. This is especially common where coastline orientation changes quickly. A beach may be labeled as west-facing, but a nearby point or island may block the most powerful west swell angles.
Too Much Swell Angle and Not Enough Direct Energy
If swell approaches a beach at an extreme angle, only part of its energy may translate into rideable surf. The waves may sweep down the beach, break unevenly, or miss the best sandbars entirely. Forecasts that do not handle directional exposure well can easily overestimate these setups.
Period-Driven Overcalls
Long-period swell is powerful, but not every long-period swell produces large surf at every spot. If the spot is shadowed, if the bathymetry bends energy away, or if the swell is too straight for the reef, the forecast may overcall it. Long-period swell can also close out certain beaches, making the surf less useful than the size suggests.
Wind and Tide Problems
A surf forecast may get swell height right but quality completely wrong. Strong cross-shore wind, extreme tides, or tidal currents can ruin otherwise good swell. Many apps reduce quality ratings based on wind, but they may not fully understand local tide behavior. Some reefs need mid tide. Some beaches need lower tide. Some points only connect on a certain tidal push.
Surf Forecasting Models and Tools: What Each One Does Best
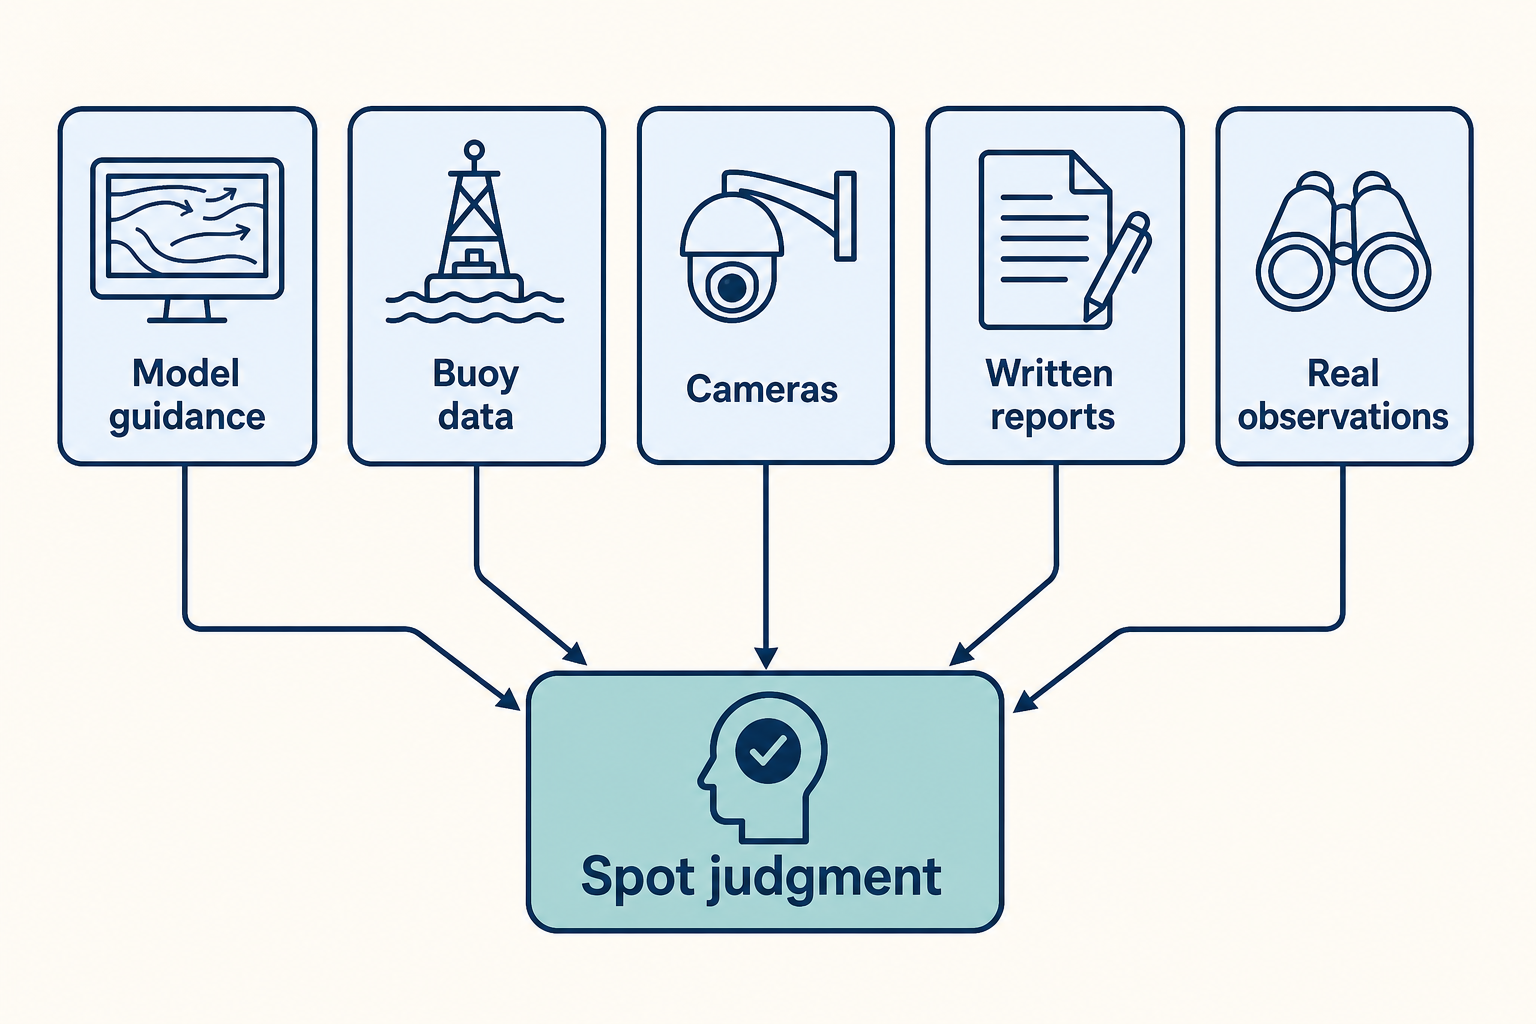
Online surf forecasting is not one single thing. A good forecast routine combines model guidance, measured buoy data, cameras, written reports, and real observations. Each tool answers a different question. Keeping a wireless indoor/outdoor weather station at home is a convenient way to monitor live barometric pressure and temperature trends before you head out, adding another layer of local context on top of what any online model provides.
Global Wave Models
Global wave models predict swell across oceans using wind fields, wave physics, and observations. The best-known public model is NOAA’s WaveWatch III, which is used directly or indirectly by many marine forecast sites. Other major sources include the European Centre for Medium-Range Weather Forecasts wave model, national meteorological agencies, and regional coastal models.
These models are excellent for tracking large-scale swell generation. They can show storm fetch, swell direction, period, and arrival time with impressive accuracy. Their weakness is local surf detail — a global model may not resolve a small reef, a harbor entrance, or a headland shadow.
Surf-Specific Forecast Platforms
Surf-specific platforms translate wave model data into surf-height forecasts for individual breaks. Examples include Surfline, Surf-Forecast, Windguru, and regional services such as Coastalwatch in Australia. Magicseaweed was once a major independent surf forecasting platform but has since been integrated into Surfline.
These sites are convenient because they combine swell, wind, tide, and spot information in one place. Some also use proprietary algorithms, human forecasters, and historical corrections. Their main weakness is that spot forecasts can look more precise than they really are — a seven-day forecast for one named break may still be based largely on offshore model data and estimated local transformation.
Wind-Focused Forecast Tools
Windy, Windguru, and PredictWind are useful because wind often decides whether surf is clean or poor. Many allow users to compare models such as the Global Forecast System and the European model alongside high-resolution regional runs. If you want to verify what these tools are actually predicting when you arrive at the beach, a handheld digital anemometer lets you measure real wind speed and direction on the spot.
Wind tools are especially valuable in areas with sea breezes, mountain effects, or shifting local patterns. A surf app may say “light wind,” while a higher-resolution wind model shows a midday onshore developing at your exact stretch of coast.
Buoy Data
Buoys provide measured ocean conditions, not predictions. In the United States, NOAA’s National Data Buoy Center and the Coastal Data Information Program are key sources. Other countries have their own buoy networks through meteorological or coastal agencies.
Buoys are powerful because they tell you what swell is actually in the water. Directional buoys measure wave height, dominant period, average period, and direction. This helps confirm whether a forecasted swell arrived early, late, bigger, smaller, or at a different angle than predicted. The limitation is location — a buoy may sit far offshore, behind an island, or well away from your break, so you still need to translate its readings to the spot.
Surf Cams
Surf cams show what is happening right now. They are useful for checking size, crowd, texture, and whether the tide is working. They are especially helpful when forecasts disagree with each other. Camera angle can make surf look smaller or bigger than it is — a wide lens may flatten wave faces, while a zoomed-in angle may exaggerate them. A cam can also miss long lulls or the best peak outside its frame. A pair of compact waterproof binoculars can help you scout the lineup from a distance when there is no cam available or when you want a better look at an outer reef.
Human Reports and In-Person Observations
Human surf reports add context that raw data cannot. A good local report may mention drift, wait between sets, crowd pressure, or whether the best waves are actually connecting. In-person observation is even better because you can judge the lineup, feel the wind, and watch several sets before deciding.
The drawback is subjectivity. One surfer’s “fun chest-high” may be another surfer’s “weak shoulder-high.” Reports also age quickly when tide, wind, or swell direction is changing rapidly. Tracking your own readings with something reliable like a marine barometer can help you sense whether conditions are improving or deteriorating based on pressure trends.
Spot Forecasts Versus Regional Surf Forecasts
Both spot forecasts and regional forecasts are useful, but they should be used differently. A common mistake is treating a spot forecast as a precise prediction rather than a localized estimate.
What Spot Surf Forecasts Are Good For
Spot forecasts are best for quick planning. They summarize expected surf size, wind, tide, and general quality at a named break. They are useful when you already know the spot’s tendencies and want a fast read on the next few days. They are also helpful for beginners because they reduce complex swell data into a simple output. If a forecast says a beach is likely waist-high and clean in the morning, that is a practical starting point even if it is not perfectly precise.
Where Spot Forecasts Can Mislead You
Spot forecasts become less reliable at breaks with complex bathymetry, narrow swell windows, or strong tide dependence. They can also be misleading during mixed swells, when two or more swells arrive from different directions. The app may display one combined surf height, but the lineup may behave very differently depending on which swell dominates the sets.
Spot forecasts can also hide uncertainty. A forecast might show “4 feet” for Saturday, but that number may depend on a storm that has not fully formed yet or a swell direction that is marginal for the break.
What Regional Surf Forecasts Are Good For
Regional forecasts are better for understanding the bigger picture. They tell you what swell is coming, where it is coming from, how long it will last, and how wind patterns are expected to evolve. This helps you choose the right type of spot rather than simply checking whether one location looks good or bad. For example, a regional forecast showing a solid west-northwest swell with strong north wind might point you toward a protected point rather than an exposed beach — something a single spot forecast may not communicate as clearly.
How to Estimate Surf Conditions at a Specific Spot From a Regional Forecast
The best surfers and forecasters learn to convert regional data into spot expectations. You do not need advanced math to do this. You need a repeatable process and a willingness to compare forecasts with what actually shows up.
Step 1: Read the Deepwater Swell Details
Start with the main swell height, period, and direction. Do not look at height alone. A smaller long-period swell can produce more powerful surf than a larger short-period swell. Longer-period swell generally has more ability to wrap, refract, and grow over shallow bathymetry, while short-period windswell is usually more local, weaker, and more affected by wind. The exact result always depends on the specific spot.
Step 2: Check Whether the Direction Fits the Spot’s Swell Window
Look at the coastline orientation and any blocking landforms. Ask whether the swell has a clean path to the break. If the swell is outside the spot’s window, reduce your size expectation significantly. If it is perfectly aimed, the spot may exceed the forecast.
A simple way to build this knowledge is to keep notes over time. Record the swell direction on days when the spot is good, average, or flat. You will eventually learn that some breaks have very specific magic angles where everything clicks. A dedicated surf log book is a great tool for tracking these patterns session by session, and it doubles as a useful reference when the same swell window opens again months later.
Step 3: Adjust for Bathymetry
Decide whether the spot tends to magnify or reduce swell. A deepwater reef, canyon-fed beach, or exposed point may be a swell magnet. A bay, lagoon, or beach behind a broad shelf may consistently come in smaller than the regional forecast. Create your own correction factor over time. If a regional forecast of 4 feet at 14 seconds usually becomes head-high at your reef, remember that. Local calibration is more valuable than any generic rule.
Step 4: Account for Tide
Tide can change both size and shape. Some spots get bigger or more powerful as the tide drops because waves break over shallower water. Others need more water to cover rocks or link sections. Beach breaks may improve on a rising tide, then turn fat and unrideable at high tide. Do not just check whether the tide is high or low — look at the timing. A spot that is poor at dawn may turn on for one hour when the tide reaches the right range.
Step 5: Compare Wind Models
Wind can be the difference between excellent surf and barely rideable surf. Check direction, speed, and timing. Offshore wind generally grooms waves clean, while onshore wind adds chop and bump. Cross-shore wind may be manageable at some points and terrible at open beaches. In places with local effects, compare more than one wind model. If two models agree on light offshore wind through mid-morning, confidence increases. If one shows calm and another shows early onshore flow, expect some uncertainty.
Step 6: Verify With Buoys and Cams
Before you drive, check the nearest relevant buoy. Is the swell height matching the forecast? Has the period peaked? Is the direction what was predicted? Then use cams to see how that ocean data is translating at the beach. If the buoy is rising but the cam still looks small, the swell may be late, the direction may not fit, or the tide may be wrong. If the cam shows bigger surf than the buoy suggests, the spot may be focusing the swell. Keeping a weatherproof field notebook in your bag makes it easy to jot down buoy readings and conditions on the go without worrying about water damage.
Step 7: Build a Personal Spot Forecast
After checking the regional forecast, spot exposure, bathymetry, tide, wind, buoy data, and cams, make your own call. For example:
- Regional forecast: 4 feet at 15 seconds from 280 degrees.
- Spot exposure: Open to west-northwest swell, partly blocked from due west.
- Bathymetry: Reef focuses longer-period swell.
- Local adjustment: Likely shoulder-high to head-high on sets.
- Quality check: Best on mid tide with light offshore wind.
This kind of reasoning is more useful than simply accepting a single number from an app. It takes time to develop, but it gets more accurate the more you practice it at spots you know well.
Common Forecast Traps That Fool Surfers
Confusing Swell Height With Surf Height
Swell height is measured offshore in deep water. Surf height is what actually breaks at the spot. They are related, but they are not the same. A 4-foot deepwater swell may produce small surf at a sheltered beach or significantly larger surf at a focusing reef — sometimes dramatically so.
Ignoring Secondary Swells
Many days include more than one swell. A primary swell may be long-period but inconsistent, while a shorter-period local swell fills in the gaps. Some forecasts blend these into a single surf-height number, which can hide the real character of the session. Watching how different swell trains interact is one of the trickier parts of reading surf forecasts accurately.
Trusting Star Ratings Too Much
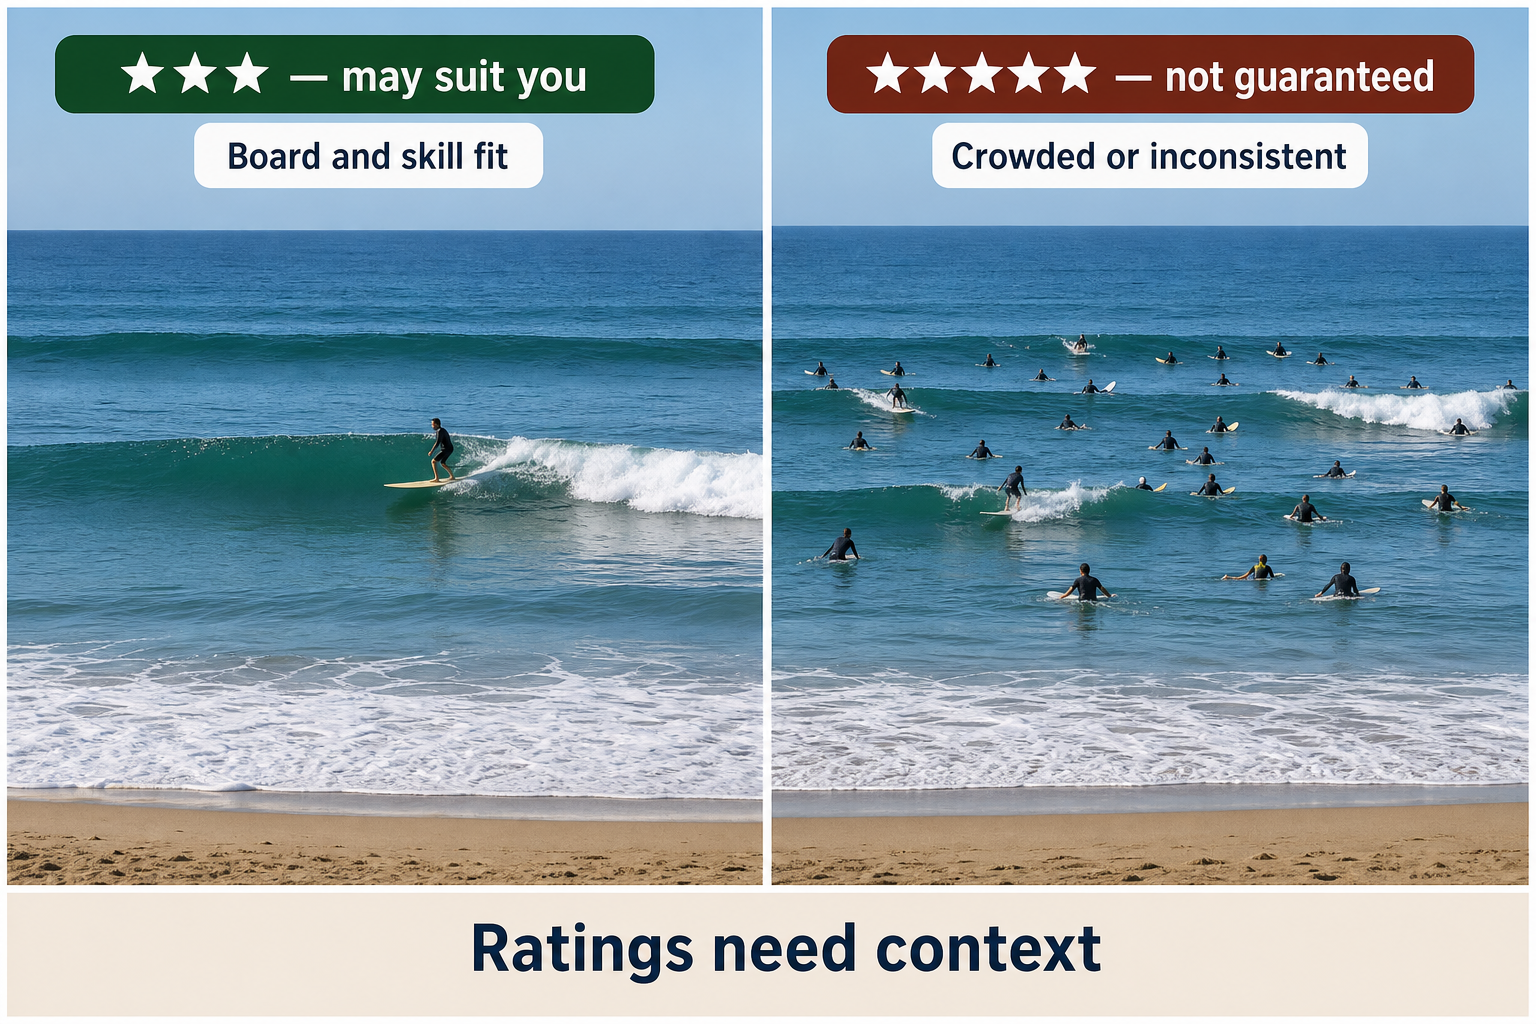
Quality ratings are convenient, but they simplify complex conditions. A three-star forecast may be excellent for a certain board or skill level. A five-star forecast may be crowded, inconsistent, or highly tide-sensitive. Use ratings as a quick clue, not a final decision. Understanding the raw swell and wind data behind any rating will always give you a better picture.
Forgetting That Forecasts Change
The further out a forecast is, the more uncertainty it carries. A swell predicted for tomorrow is usually far more reliable than one predicted for next week. Long-range charts are best for spotting possibilities and planning your schedule, not for making precise session calls. Check back regularly as the swell approaches and your confidence in the forecast will grow accordingly.
How to Get Better at Reading Surf Forecasts
The fastest way to improve is to compare predictions with real outcomes. Choose a few local breaks and track them closely. Save screenshots of regional forecasts, note buoy readings, check cams, then write down what actually happened. A NOAA weather alert radio is a practical addition to your routine since it delivers real-time marine and coastal weather updates that can help you stay on top of fast-moving changes between forecast updates.
Pay close attention to swell direction, period, tide stage, and wind timing in your notes. Over time, patterns become obvious. You may learn that one beach is always smaller on northwest swell, another doubles with south swell, and a reef only works when the period is above 14 seconds.
Recording sessions on the water also helps. If you want footage to review later, an action camera with waterproofing and stabilization can capture your sessions and show you how the conditions actually look compared to what the forecast predicted. Pair it with a high-speed microSD card so you have plenty of storage and smooth playback for reviewing your footage. This process turns forecasting from guesswork into pattern recognition, and your local interpretation eventually becomes more valuable than anything any app can provide.
When you are checking spots you do not know well, a rugged handheld GPS navigator is a useful tool for marking takeoff zones, access points, and spots where the swell seemed to focus or fade. Paired with a reliable orienteering compass, it gives you a clearer sense of the coastline orientation at any break — which matters when you are trying to figure out a spot’s exact swell window. And if you are checking forecasts and buoy data from your phone in the water or on the beach, a waterproof phone pouch keeps your device protected from spray and sand while you work through your pre-session checklist.
Surf forecasts get it wrong because the ocean is complex and every surf spot is local. Models can predict swell moving across deep water with impressive skill, but the final breaking wave depends on coastline shape, seafloor contours, swell angle, tide, and wind. The most reliable approach is to use forecasts as a foundation, then refine them with buoy data, cams, human reports, and your own accumulated experience. Once you understand how your spots magnify, block, or reshape incoming swell, forecast “mistakes” become easier to anticipate — and sometimes they lead you straight to the best waves of the week.