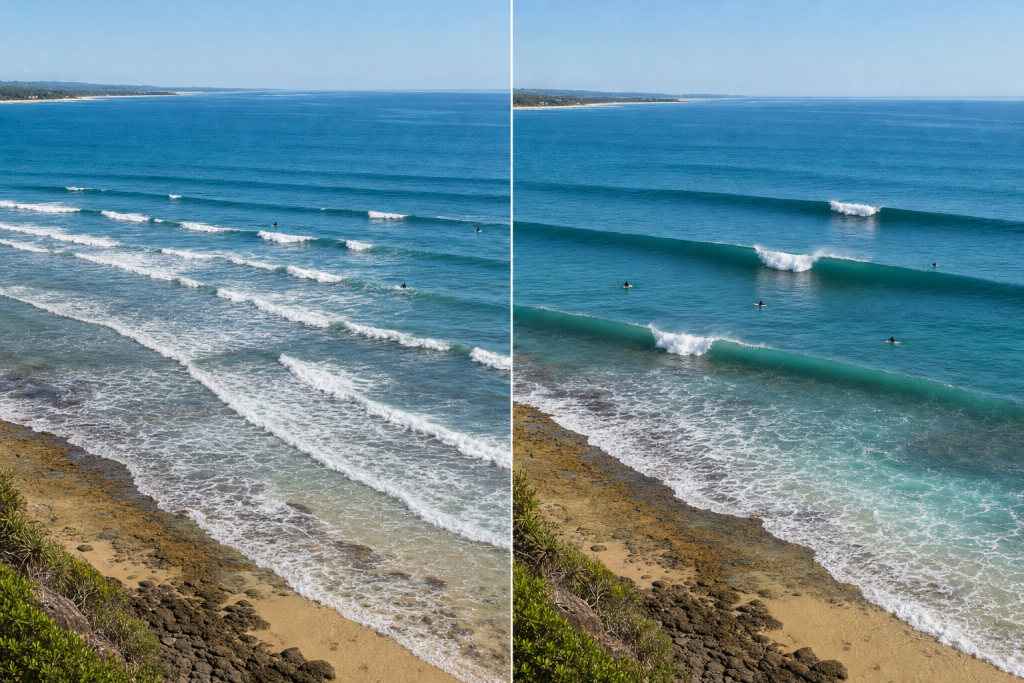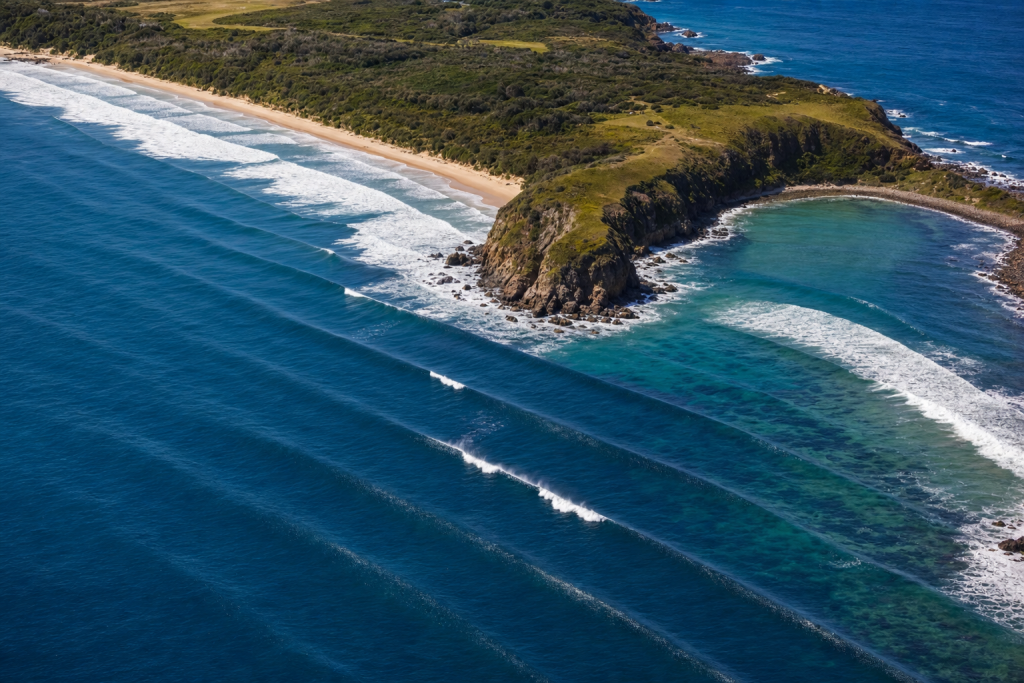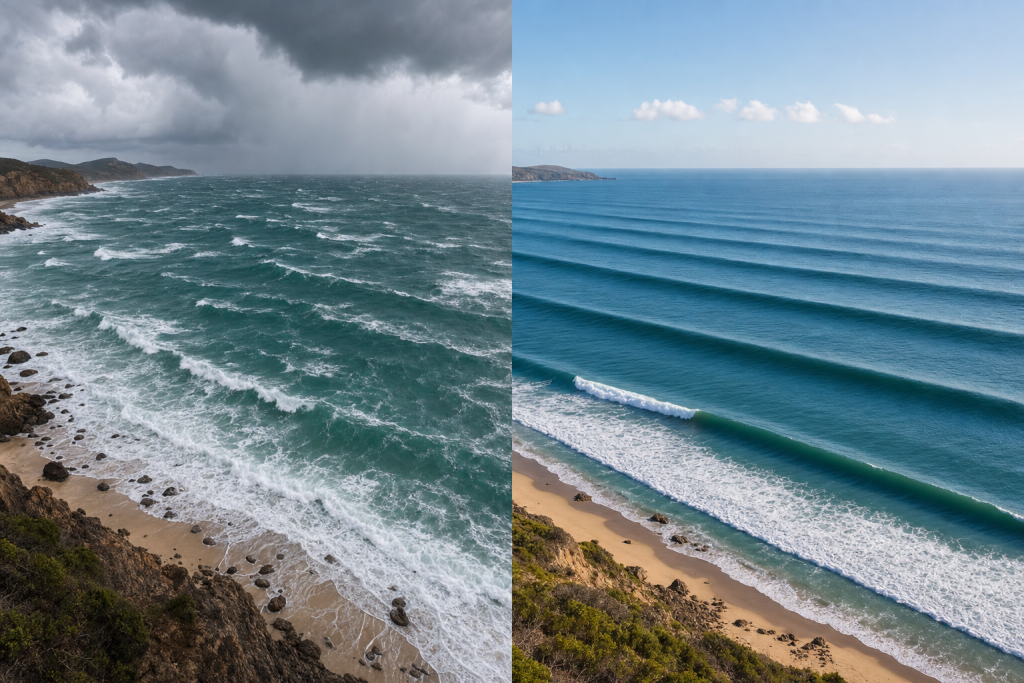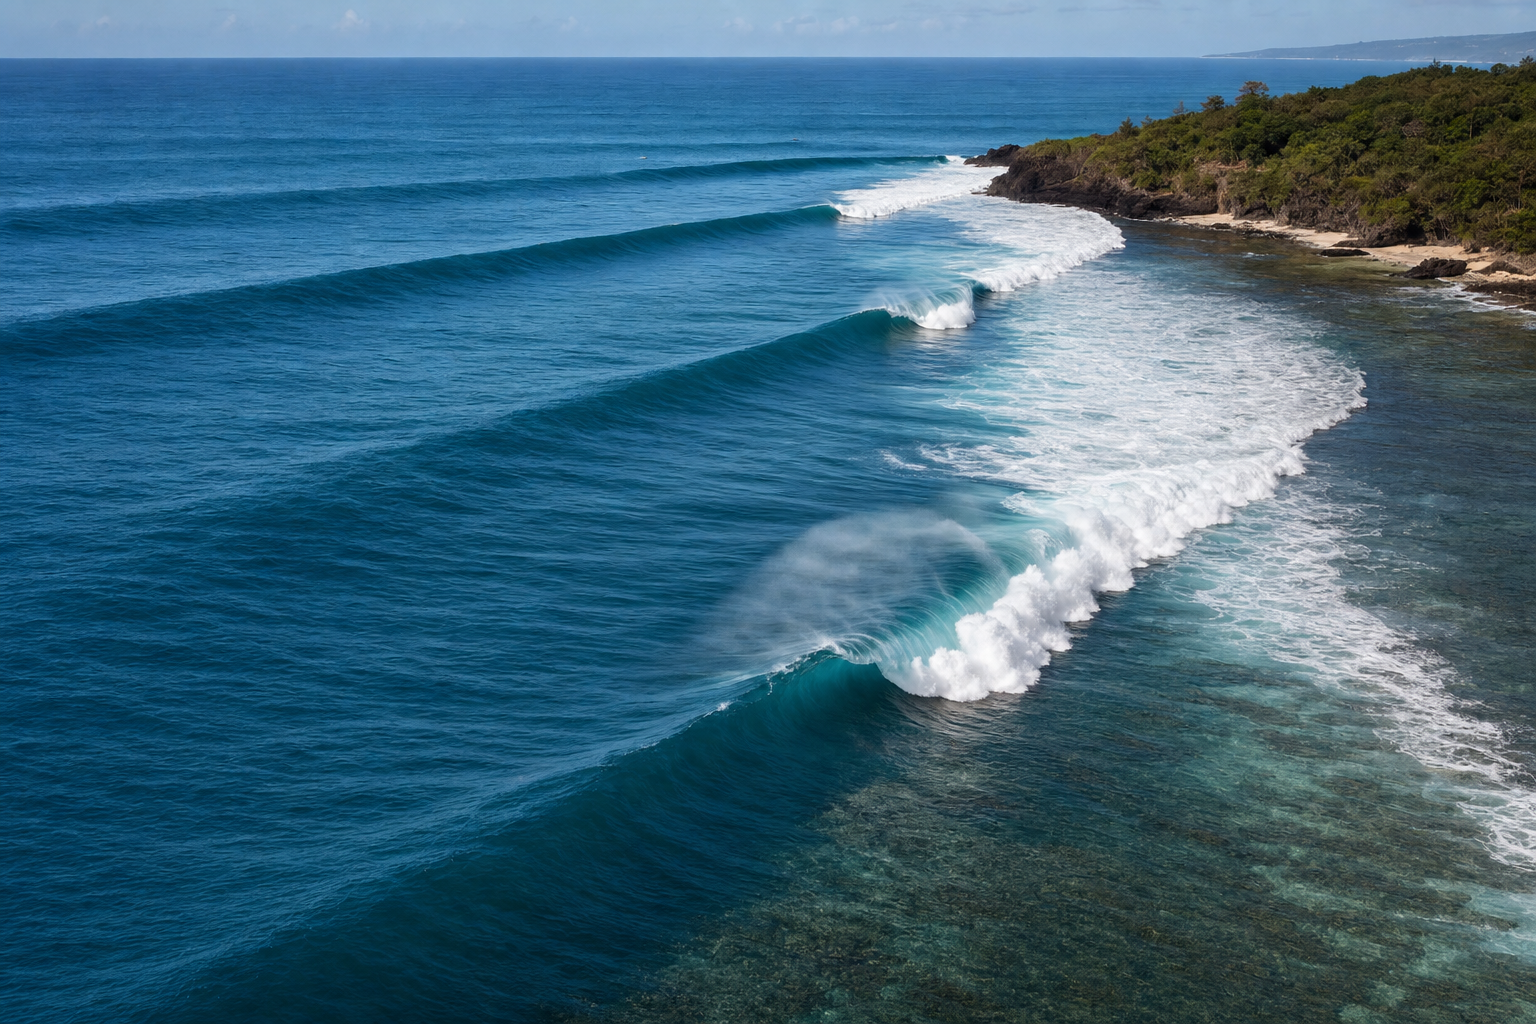
Swell power is one of the main reasons a surf forecast can look straightforward on paper but feel completely different in the water. A buoy might show a “4-foot swell,” yet one 4-foot swell produces soft shoulder-high waves while another creates thick overhead sets at the same break. The difference is not magic — it comes from how much energy the swell carries, how fast that energy is moving, and how the swell interacts with the coastline. Learning to read swell power helps surfers understand not only how big the waves may be, but also how fast, heavy, and consistent they are likely to feel. If you want to go deeper on this topic, this surf forecasting book breaks down the science of reading the ocean in plain language.
What Swell Power Means in Surf Forecasting
Swell power describes the amount of wave energy traveling through the ocean and eventually reaching a surf spot. It is not the same thing as swell height. Height matters a lot, but period, direction, and the shape of the seafloor can completely change the surf that results from a given swell.
A swell is created when wind transfers energy into the sea surface. Once that wave energy moves away from the storm area, it becomes swell. Unlike local wind chop, swell is more organized and can travel thousands of miles before reaching land. Understanding the bigger picture of how tides and ocean energy interact can also sharpen your forecasting instincts — this book on ocean science is a worthwhile read for any surfer curious about how the sea works.
Surfers often use the word “power” in a practical way. A powerful swell usually means more water moving through the lineup, faster and more forceful breaking waves, and longer lines with more defined sets. In physics, wave energy is closely tied to wave height, while wave power also depends on how quickly that energy travels. That is why swell period is so important — a longer-period swell of the same height usually carries more usable energy toward the coast than a shorter-period swell.
How Swell Power Is Measured
Most surf forecasts do not measure swell power directly in the way a speedometer measures speed. Instead, they calculate or infer it from wave height, wave period, and wave direction. The best data comes from directional buoys, satellite observations, and numerical wave models.
Swell Height
Swell height is usually reported as significant wave height — the average height of the highest one-third of waves measured during a sampling period. It is not the height of every wave, and it is not the maximum possible wave height.
If a buoy reports a 6-foot swell, some waves will be smaller and some individual waves may be noticeably larger. This is one reason surf can occasionally exceed what the raw buoy number suggests.
Swell Period
Swell period is the time between passing wave crests, measured in seconds. A 16-second swell has much more distance between wave crests than an 8-second swell. That spacing is called wavelength, and it increases rapidly as period increases.
In deep water, wavelength is approximately:
Wavelength in meters ≈ 1.56 × period²
That means an 8-second swell has a wavelength of about 100 meters, a 12-second swell has a wavelength of about 225 meters, and an 18-second swell stretches to about 505 meters. Long-period swells move faster, feel the seafloor earlier, and often transform more dramatically as they approach the coast.
Swell Direction
Swell direction tells you where the swell is coming from. Under standard marine convention, a 270-degree swell comes from the west and travels east. This matters because every surf spot has a swell window — headlands, islands, reefs, and continental shelves can all block or bend incoming energy.
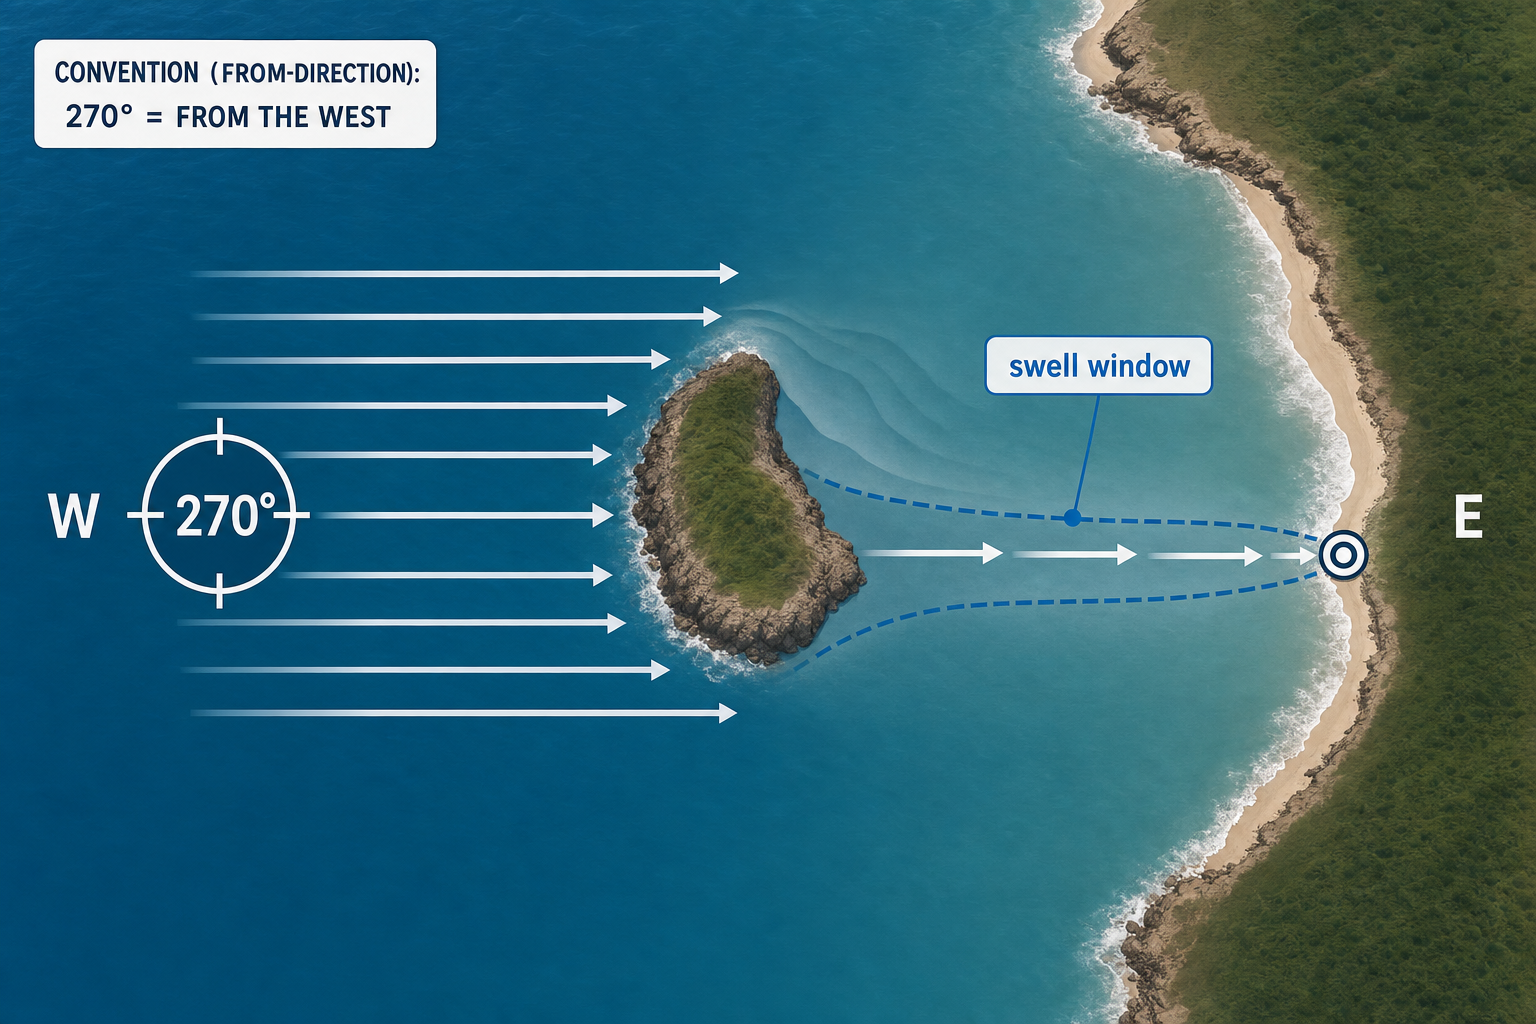
A beach that performs well on a west swell may be disappointingly small on a southwest swell, even if both swells are the same height and period offshore.
Swell Spectrum
The most useful buoy and model data often comes from the wave spectrum, which separates the sea state into different energy bands. This matters because the ocean can carry several swells at once. A buoy might show 3 feet at 16 seconds from the southwest, 4 feet at 9 seconds from the west, and 2 feet at 6 seconds from local wind — all at the same time. The combined sea height can hide what is really happening. For surfing, the individual swell partitions are usually far more useful than a single combined number.
The Basic Swell Power Formula
In deep water, wave power per meter of wave crest can be estimated with this formula:
P ≈ 0.49 × Hs² × Te
Where P is power in kilowatts per meter of wave crest, Hs is significant wave height in meters, and Te is energy period in seconds. If using feet for swell height, a rough version is:
P ≈ 0.046 × height in feet² × period
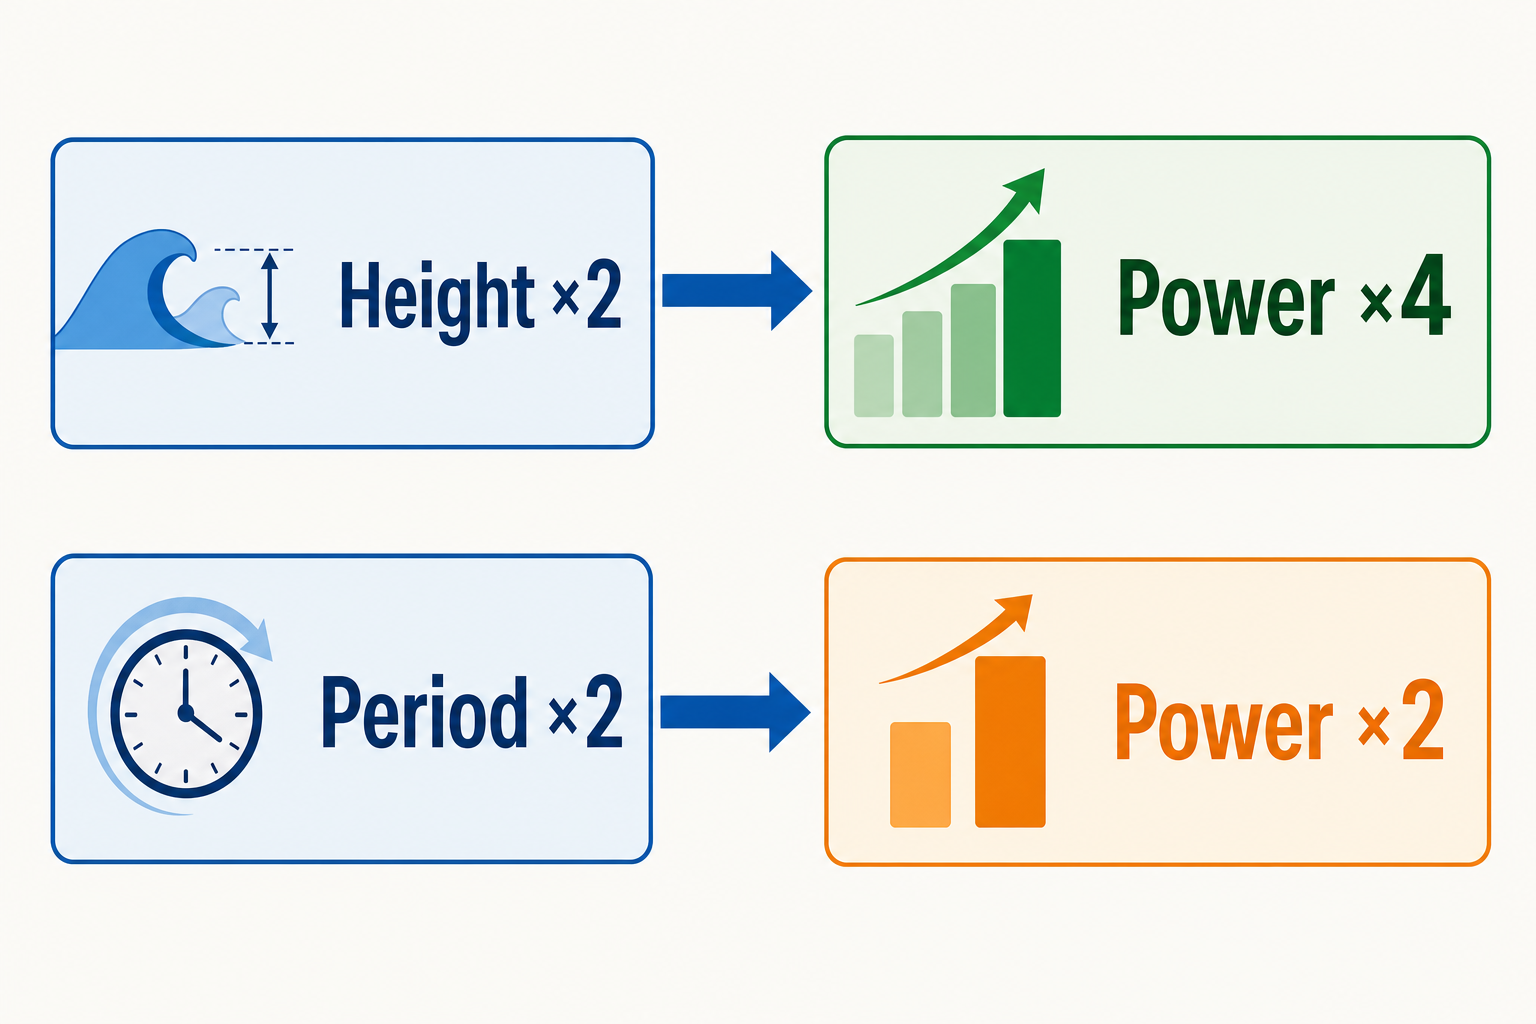
This is an approximation, and surf forecasts may use peak period instead of energy period. Still, the relationship is extremely useful: wave power increases with the square of wave height and increases linearly with period.
| Swell | Approximate Deep-Water Power | Likely Surf Character |
|---|---|---|
| 4 ft at 8 sec | About 6 kW/m | Shorter, weaker, more windswell-like |
| 4 ft at 16 sec | About 12 kW/m | Longer lines, more push, bigger surf potential |
| 6 ft at 16 sec | About 26 kW/m | Much more energy because height is squared |
The jump from 4 feet to 6 feet is not a small change. Because height is squared, a 6-foot swell at the same period carries more than twice the deep-water power of a 4-foot swell.
How Swell Power Affects Surfing Waves
Swell power affects surf in several ways. It influences how big waves get near shore, how they break, how fast they run down the line, and how much water moves around the lineup.
Swell Power and Surf Height
Open-ocean swell height is not the same as breaking wave height. As swell enters shallower water, it slows down. The wavelength shortens and the wave may grow taller — a process called shoaling.
Long-period swell starts feeling the bottom in deeper water because its energy extends farther below the surface. A 16-second swell can begin transforming far offshore, while an 8-second swell may not react strongly until much closer to the beach. This is one reason a long-period 4-foot swell can produce larger and more powerful surf than a short-period 4-foot swell — the open-ocean height is the same, but the coastal transformation is not.
Swell Power and Wave Shape
Powerful swells often create waves with more speed and projection. On reefs and points, this can produce long, clean walls. On steep reefs, it can create hollow waves that stand up quickly and throw hard.
At beachbreaks, too much swell power can cause waves to close out if the sandbars cannot handle the energy. A softer, shorter-period swell may actually produce more workable peaks at the same beach. This is why “more powerful” does not always mean “better” — the best swell is the one that matches the break. If you are shooting sessions to analyze wave shape or track your surfing, a waterproof action camera mounted on the shore or in the water can be a useful tool. A high-capacity microSD card will keep you from running out of storage mid-session.
Swell Power and Wave Speed
Long-period swells typically create faster-breaking waves. The wave carries more momentum as it interacts with the bottom, and the resulting surf often requires better positioning and quicker decision-making. Pointbreaks and reef passes can come alive under this kind of swell because the wave has enough energy to wrap, bend, and keep running down the line. A weak windswell may break in the same place but fade quickly after the initial section.
Swell Power and Set Behavior
Swell energy travels in groups, which is why waves arrive in sets rather than as evenly spaced individual waves. Long-period groundswell often produces more defined sets with longer lulls between them. The first energy from a distant storm is usually the longest-period energy. These early waves may be inconsistent, but they are strong indicators of a rising swell.
Why Two Swells of the Same Height Can Make Different Waves
Two swells can share the same offshore height and still produce completely different surf. Height is only one part of the forecast — period, direction, bottom contours, and swell quality can all change the result dramatically.
Same Height, Different Period
Imagine two readings from the same offshore buoy: 5 feet at 8 seconds, and 5 feet at 17 seconds. The first is likely a local or regional windswell with shorter wavelengths, less organized energy, and less ability to wrap into protected areas. The second is likely a groundswell from a stronger or more distant storm. It travels faster, shoals earlier, and can focus more energy onto reefs, points, or submarine canyons. At many breaks, the 5-foot at 17-second swell will produce significantly larger and more powerful surf than the 5-foot at 8-second swell.
Same Height, Different Direction
Direction can be just as important as period. A 4-foot west swell and a 4-foot south swell may look equal on a buoy, but a particular beach may be fully exposed to one and almost completely blocked from the other.
Swell direction also affects wave shape. A pointbreak often needs the swell to arrive at an angle so the wave can peel along the point. If the swell comes in too straight it may break too quickly, and if it arrives too obliquely it may not connect through. Getting to know your local coastline is essential — a good guide to reading nautical charts can help you understand how swell direction relates to underwater contours and coastal geography.
Same Height, Different Seafloor
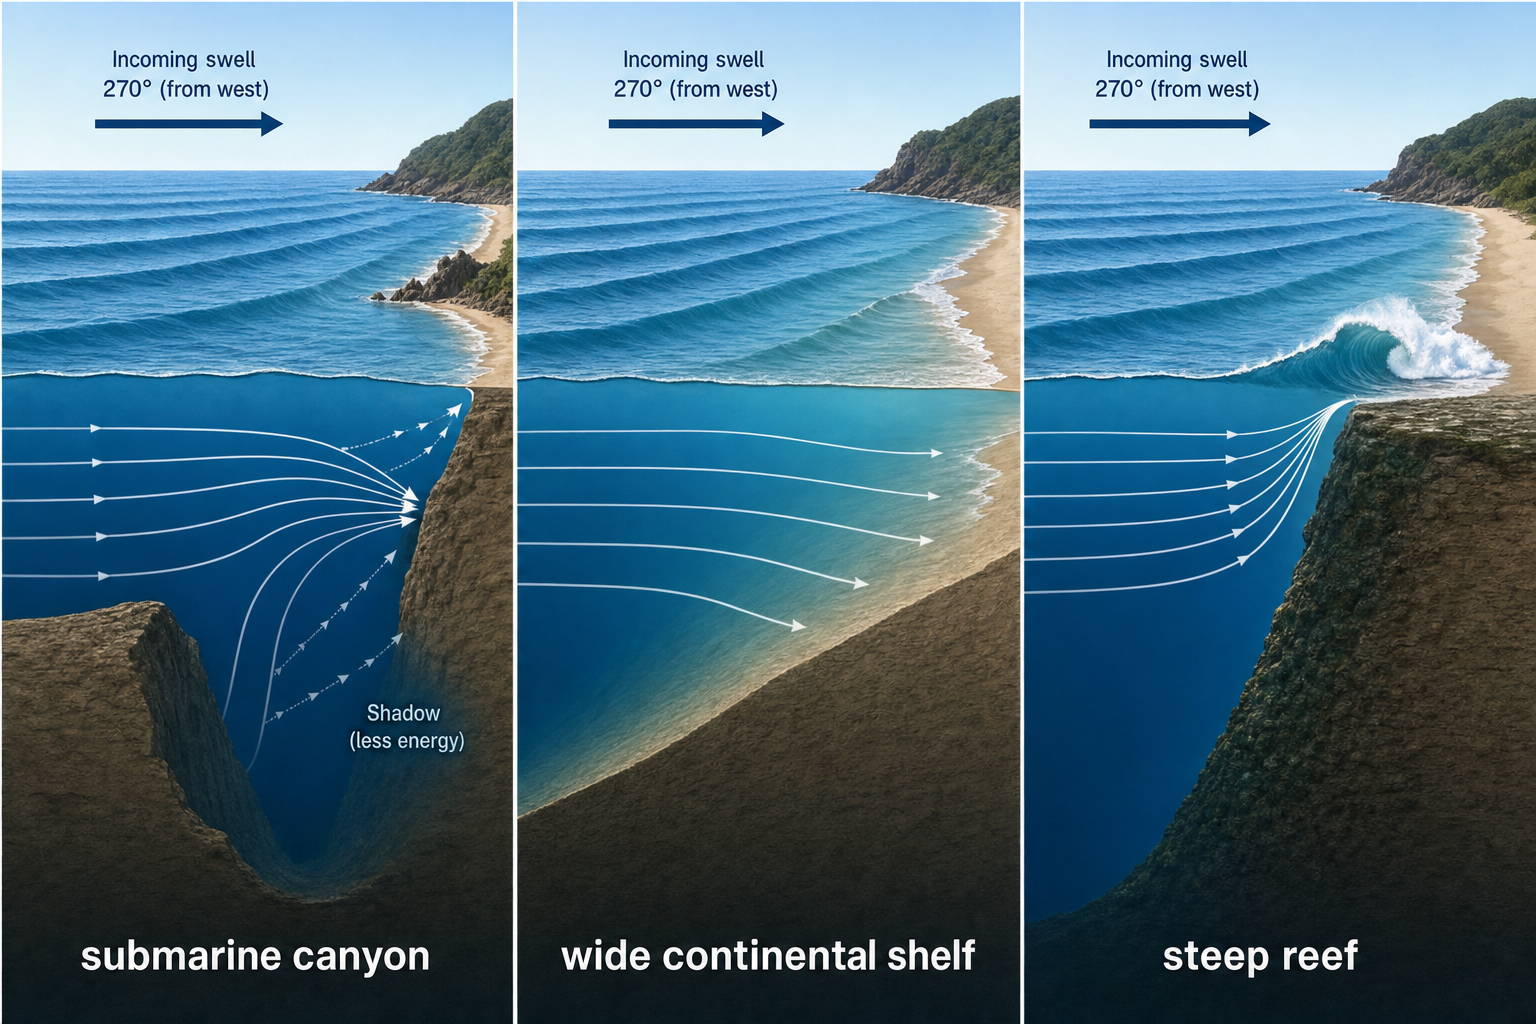
Bathymetry — the underwater shape of the coast — determines how swell energy is bent, focused, or spread out before it breaks. Shoaling slows waves down and often increases their height, refraction bends waves as parts of the swell line slow in shallower water, and shadowing occurs when landforms or reefs block part of the incoming energy.
A submarine canyon can focus swell onto one beach while nearby beaches stay small. A wide continental shelf can drain energy from some swells before they reach shore. A steep reef can turn a moderate swell into a much heavier breaking wave. If you enjoy studying underwater contours and coastal maps, a coastal navigation training chart is a practical resource for learning how to read those features.
Same Height, Different Swell Quality
Not all swells are equally organized. A clean groundswell from a distant storm may have a narrow directional spread and a clearly defined period. A messy local windswell may include a wider mix of periods and directions arriving simultaneously. A cleaner swell usually produces more organized lines and predictable sets. A mixed sea state tends to create crossed-up peaks, uneven sets, and inconsistent wave shape.
What Creates Swell Power in the First Place
Swell power begins with the storm that generates the waves. The classic ingredients are wind speed, fetch, and duration.
Wind Speed
Stronger wind transfers more energy into the ocean surface. All else being equal, more intense storms can produce larger waves and longer-period swell. If you are checking conditions from the beach before paddling out, a handheld anemometer gives you an accurate local wind reading, which is useful for assessing how clean the surf is likely to be.
Fetch
Fetch is the distance over water that wind blows in a consistent direction. A long fetch gives waves more room to grow. If the fetch is aimed at your coast, more of that energy can travel into your surf zone and produce well-organized groundswell.
Duration
Duration is how long the wind blows over the same area. A short burst of wind may create steep, choppy local seas. A long-lasting storm builds more organized swell with longer periods and better definition. Some of the strongest swells come from storms that move in the same direction as the waves they are generating, creating a moving fetch that continuously adds energy to the swell.
How to Compare Swell Power in a Surf Forecast
When reading a forecast, do not stop at the headline surf height. Look at the underlying swell data. A good swell-power check follows a simple sequence.
1. Separate the Swell Partitions
Look for individual swells rather than the combined sea height. A forecast that says “6 feet combined seas” may include several smaller swells mixed with local wind chop. For surfing, a clean 3-foot groundswell is often more valuable than a larger but messier combined sea.
2. Check the Period
Period gives important clues about how the swell will behave near shore. Under 8 seconds is typically local windswell — usually weaker and less organized. Nine to 12 seconds is a mid-period swell, often useful at exposed beaches. Thirteen seconds and above is groundswell with stronger surf potential and more significant coastal transformation. These ranges are not absolute, and local geography can shift the picture, but they are a reliable starting point.
3. Match Direction to the Swell Window
Every spot has a preferred swell window. Study which directions work best at the breaks you surf regularly. Over time, you may find that one spot performs best on a narrow band such as 200 to 220 degrees, while another handles a much wider range. Also check whether the direction shown in the forecast is the swell’s origin direction — most marine data reports where the swell is coming from, not where it is going.
4. Consider the Seafloor
Long-period swell bends more and responds to deep-water features earlier. This can help it wrap into sheltered spots, but it can also focus too much energy onto certain banks or reefs. Shorter-period swell is less affected by deep-water bathymetry and may produce smaller but peakier surf at exposed beachbreaks.
5. Compare With Past Sessions
The best surf forecasters build a memory bank over time. Save notes from good sessions — swell height, period, direction, tide, and wind conditions. A dedicated surf log book makes it easy to track this data across sessions. If you prefer something more durable for use at the beach, a weatherproof notebook holds up well in wet conditions. After a few seasons of notes, you will start to recognize that one spot loves 3 feet at 15 seconds from the southwest, while another needs 6 feet at 10 seconds from the west to really turn on.
Online Resources for Open-Ocean Swell Height and Direction
Open-ocean swell data is most useful before the swell has been heavily altered by local reefs, beaches, or headlands. The goal is to find the nearest relevant deep-water buoy or model point, then adjust your expectations for your local coastline. A wireless weather station at home can also help you track local pressure and wind trends, which complement the offshore data. Before heading to the beach, keep your phone dry and accessible with a waterproof phone pouch so you can check forecasts right up until you paddle out.
Buoy and Observation Resources
- NOAA National Data Buoy Center: Real-time buoy data for the United States and many offshore waters. Look for significant wave height, dominant period, and swell direction when available.
- Coastal Data Information Program: Excellent directional buoy data, especially for California, Hawaii, and parts of the Pacific. CDIP’s spectral plots are particularly useful for identifying multiple swells within the same sea state.
- PacIOOS Wave Buoys: Helpful observations and forecasts for Hawaii and the broader Pacific region.
- Sofar Ocean Spotter Network: Public data from compact drifting and moored wave buoys in selected ocean regions.
Wave Model and Forecast Resources
- NOAA WaveWatch III: A major global wave model used by many marine forecasts and surf tools worldwide.
- NOAA Ocean Prediction Center: Marine charts and offshore forecasts for large ocean basins.
- Copernicus Marine Service: Global and regional wave analysis with swell height, period, and direction data.
- Windy: A visual model viewer that lets you compare wave models and inspect primary swell, secondary swell, and wind waves on an interactive map.
- Stormsurf: Useful swell charts, virtual buoys, and storm tracking tools for several ocean basins.
- Surfline and Buoyweather: Surf-focused forecasts that translate offshore swell data into local surf estimates.
How to Use These Resources
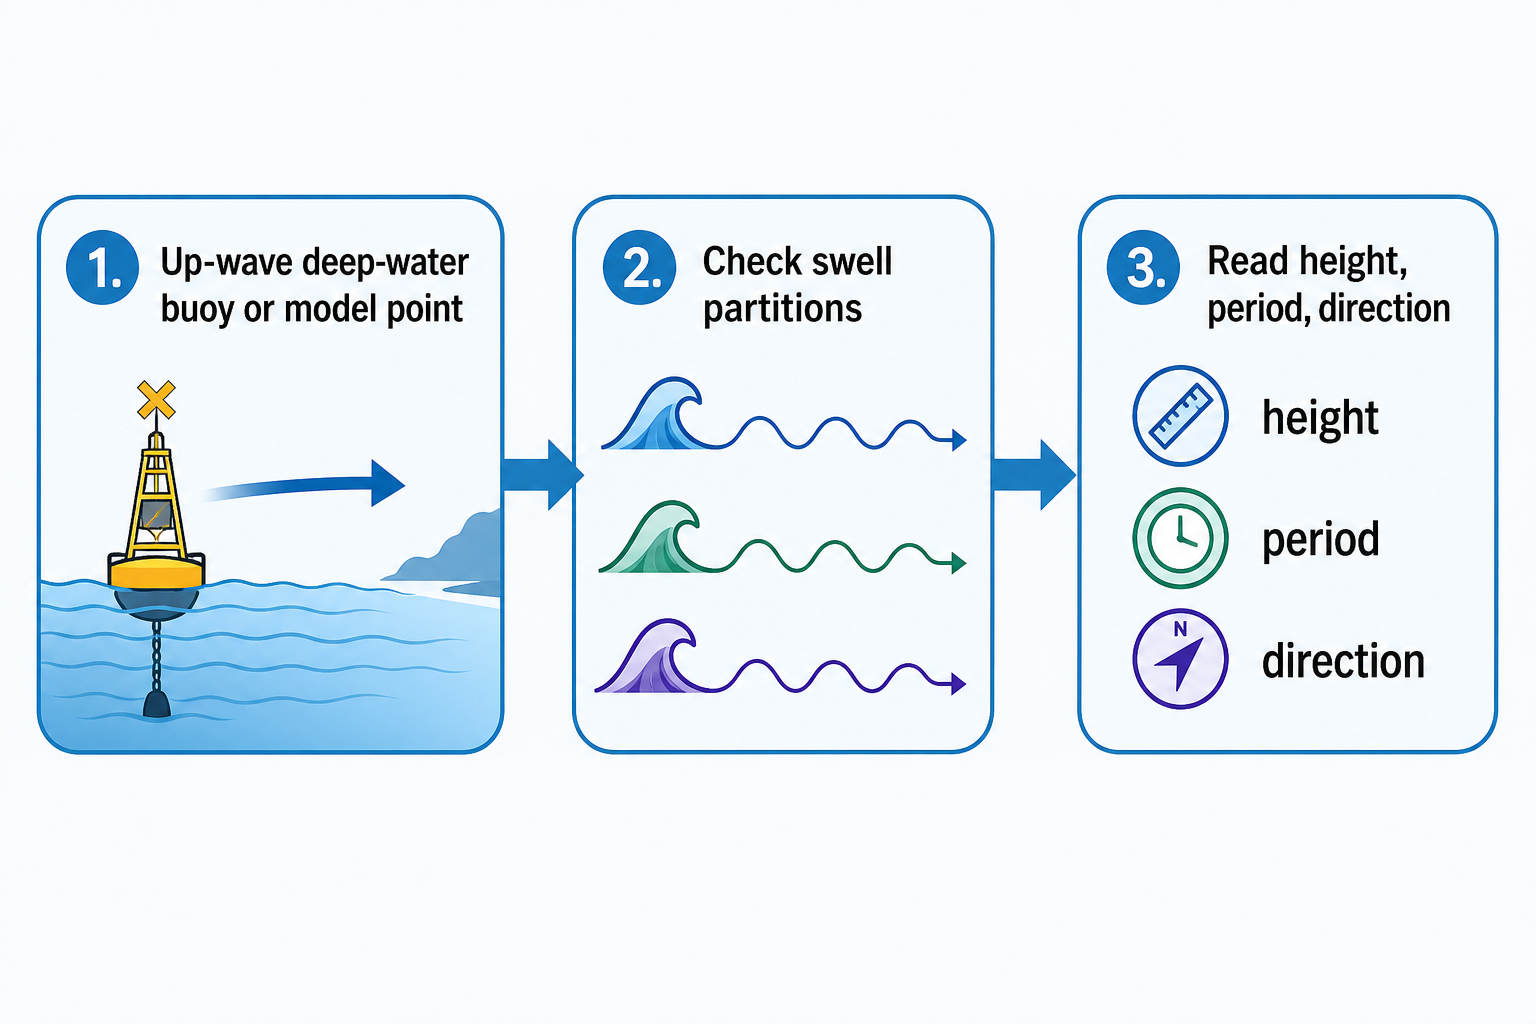
Start with a deep-water buoy or model point that is up-wave from your coast. Check the swell partitions rather than only the combined sea height, and focus on swell height, period, and direction. Next, compare the incoming direction with the break’s exposure — a swell can look impressive offshore but arrive from outside the local swell window and produce little at your spot. Finally, compare model data with real buoy trends. If the buoy is rising faster than the forecast predicted, the swell may arrive earlier or stronger than expected. A good orienteering compass can help when you are trying to precisely identify swell angles relative to the shoreline while scouting a new break. If you are checking a distant or elevated vantage point to read incoming swell lines, a pair of compact binoculars makes it easier to see set patterns before you paddle out.
Swell Power Is Useful, But Local Knowledge Completes the Forecast
Swell power gives you a strong foundation for understanding a surf forecast, but it does not predict everything on its own. Local wind, tide, sand movement, and bathymetry all decide how offshore energy becomes actual breaking waves. A powerful long-period swell may be perfect for a deepwater reef but too lined-up for a nearby beachbreak. A weaker mid-period swell may be forgettable at a point but excellent on a shifting sandbar. The more you connect buoy readings to what you actually see in the water, the sharper your surf calls become.
When you understand swell power, a forecast becomes more than a set of numbers. Swell height tells you how much the sea surface is moving, period tells you how strongly that energy travels toward shore, and direction tells you whether it can actually reach your break. Put those pieces together with local knowledge and a few seasons of notes, and you can start to see clearly why two swells of the same height can create entirely different waves. That understanding is what separates a surfer who reads a forecast from one who truly knows how to use it. If you want to keep building that knowledge, a tide clock is a simple addition to your routine that keeps tidal timing front of mind — because even the most powerful swell only delivers its best on the right tide. Adding a set of replacement surfboard fins to your kit also ensures you are ready to swap setups when the swell character changes and a different fin configuration might suit the conditions better.