North Pacific swell generation is one of the most important engines in global surf forecasting. A single winter storm south of the Aleutian Islands can send long-period swell to Hawaii within days, reach California shortly after, and even deliver small but clean lines to north-facing reefs across the South Pacific. To understand why some swells arrive huge and organized while others fade into weak wind chop, you need to read the storm, the season, the swell window, and the path the energy takes across the ocean. If you want to go deeper into the science behind all of this, this surf forecasting guide is a great place to start.
How North Pacific Swells Are Generated
A swell begins when wind transfers energy into the ocean surface. The stronger the wind blows, the longer it blows, and the farther it blows over open water, the larger and longer-period the swell becomes. In the North Pacific, the best surf-producing storms usually combine three key ingredients:
- Strong wind speed: Gale-force winds run from 34 to 47 knots. Storm-force winds reach 48 to 63 knots. Hurricane-force winds exceed 64 knots.
- Long fetch: Fetch is the uninterrupted stretch of ocean over which wind blows in the same general direction.
- Long duration: A storm that holds its direction for 24 to 48 hours builds a much cleaner and more powerful swell than a short-lived burst.
Wave period is the key difference between local wind waves and high-quality groundswell. Short-period waves of 7 to 10 seconds are usually steep and disorganized. Medium-period swell of 11 to 14 seconds can be very surfable, especially close to the source. Long-period swell of 15 to 22 seconds is the hallmark energy produced by strong North Pacific storms — these waves travel faster, refract more strongly over underwater topography, and can wrap into exposed coastlines from thousands of miles away. Understanding the ocean science behind all of this is worth your time; a solid oceanography textbook can give you a strong foundation in wave physics and ocean dynamics.
Why Moving Fetch Matters for North Pacific Swell
The best North Pacific swell events often come from a moving fetch. When a storm moves in roughly the same direction as the swell it is producing, the developing waves stay under strong wind for longer, allowing the sea state to build more efficiently. This is why a compact low with powerful winds can sometimes underperform, while a larger storm with a well-aligned fetch overdelivers. The alignment between storm track and swell direction is often just as important as the storm’s central pressure.
The Weather Pattern Behind North Pacific Swell Generation
Most major North Pacific swells are produced by extratropical cyclones — cold-core storms that form along strong temperature contrasts between polar air and milder subtropical air. In winter, frigid air spills out of Siberia, Alaska, and the Arctic while the ocean stays comparatively warm, especially near the Kuroshio Current east of Japan. That temperature contrast strengthens the jet stream and creates the pressure gradients needed to fuel large storms.
The Aleutian Low and Winter Swell Production
The Aleutian Low is the dominant winter pressure feature in the North Pacific. It is not one fixed storm, but a broad region where low pressure frequently develops between Japan, the Aleutian Islands, and the Gulf of Alaska. When it is strong, storms often deepen into the 960 to 980 hectopascal range, and intense bomb cyclones can drop into the 930 to 950 hectopascal range. The lower the pressure and the tighter the isobars, the stronger the winds are likely to be.
The best swell-producing setup often includes a deep low to the north and a strong high-pressure system to the south or southwest. The pressure difference between them creates a broad band of west, northwest, or north winds over open water — the kind that builds the classic winter swells hitting Hawaii, North America, and exposed islands across the Pacific. Keeping an eye on barometric trends is a useful habit for any serious surf forecaster. A marine barometer lets you track local pressure changes in real time.
Temperature, Pressure, and the Jet Stream
North Pacific storms intensify when upper-level support from the jet stream lines up with surface low pressure. A strong jet stream creates divergence aloft, which allows air to rise from the surface. As surface air rises, pressure falls, the gradient tightens, and winds strengthen. Cold air outbreaks over relatively warm water add fuel to the process — heat and moisture from the ocean destabilize the lower atmosphere, which is especially common near Japan where cold continental air crosses the warmer Kuroshio region.
What North Pacific Swell-Producing Storms Look Like on a Weather Map
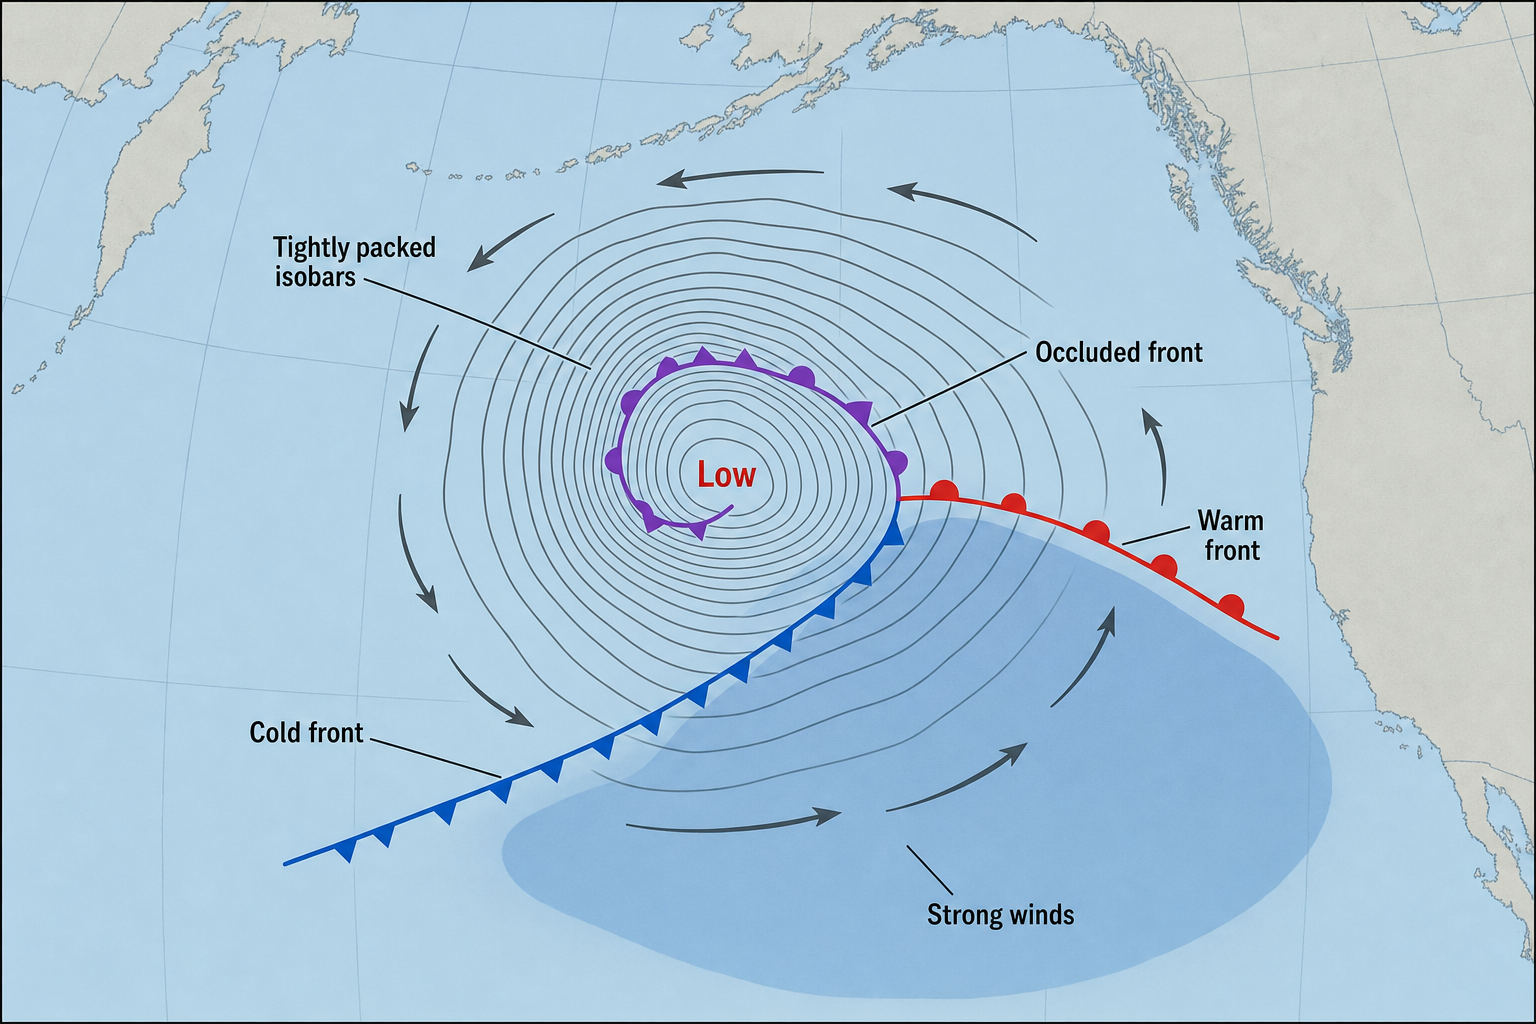
On a surface weather map, a strong North Pacific swell producer usually appears as a large, mature low-pressure system with tightly packed isobars. The storm may have a cold front trailing southwest, a warm front extending east, and an occluded front wrapping near the center. Getting comfortable reading these maps is one of the most valuable skills a surfer can develop. A good weather reference book can help decode the terminology and map symbols you will encounter on forecast charts.
Classic Winter Storm Map Pattern
A high-quality winter swell setup typically shows these features on the map:
- A deep low south of the Aleutians or near the Gulf of Alaska.
- Closely packed isobars on the southwest or south side of the low.
- A long fetch of west or northwest wind aimed at the target coastline.
- Wave model seas of 25 to 45 feet inside the storm area.
For Hawaii, the best fetch is often aimed southeast from the central or western North Pacific. For California, Oregon, and Washington, the best fetch is usually aimed east or southeast across the basin. For Japan and much of Asia, nearby typhoons and regional lows tend to matter more than distant Aleutian storms. Studying a detailed world atlas helps you visualize the geometry between storm locations and coastlines — a surprisingly useful forecasting tool.
How Typhoons Appear on North Pacific Weather Maps
Typhoons are warm-core tropical cyclones that develop over warm western North Pacific water, typically when sea surface temperatures reach around 26.5°C or warmer. A mature typhoon appears as a compact low with a tight circular pressure gradient and curved rain bands. When a typhoon recurves northeast of Japan, it can transition into an extratropical storm and expand dramatically. This transition often creates excellent swell because the system combines tropical energy with the broader wind field of a mid-latitude storm. Japan, Taiwan, and the Philippines are the main regional beneficiaries, though recurving systems occasionally send long-period northwest swell across a wider stretch of the Pacific.
Seasonal North Pacific Swell Patterns
The North Pacific has a strong seasonal rhythm. Winter is the main season for large extratropical storms. Late summer and autumn favor typhoons. Summer is usually quieter for classic North Pacific groundswell, though trade-wind swell and local wind swell remain important in some regions.
| Season | Main Storm Type | Typical Swell Direction | Typical Period | Typical Quality |
|---|---|---|---|---|
| December to February | Deep Aleutian and Gulf of Alaska lows | WNW, NW, N | 14 to 22 seconds | Powerful groundswell; quality depends heavily on local wind |
| March to May | Fading mid-latitude lows | W, WNW, NW | 11 to 17 seconds | More mixed; still capable of strong events |
| June to August | Trade-wind fetches and western Pacific typhoons | NE trades or typhoon-dependent | 7 to 18 seconds | Small in many North Pacific swell windows; excellent near typhoon tracks |
| September to November | Typhoons and early winter lows | W, NW, or SE depending on region | 10 to 20 seconds | Highly variable; can produce clean early-season groundswell |
Typical North Pacific Storm Swell Heights
Swell height changes dramatically with distance, direction, and coastal exposure. The ranges below refer to exposed deepwater swell or open-coast surf potential — not guaranteed breaking wave faces at every beach.
| Storm Type | Seas Inside Storm | Arriving Swell Period | Typical Arriving Swell | Best Surf Character |
|---|---|---|---|---|
| Large western North Pacific low | 25 to 50 feet | 15 to 22 seconds | Moderate to large at Hawaii and North America | Long-lined, powerful, and well organized |
| Gulf of Alaska low | 20 to 40 feet | 10 to 17 seconds | Large for the West Coast; variable for Hawaii | Can be raw if close; cleaner if winds improve |
| Compact typhoon | 15 to 40 feet | 10 to 18 seconds | Strong near Asia; smaller at long range | Very directional and often inconsistent |
| Recurving typhoon | 25 to 50 feet | 14 to 20 seconds | Excellent for Japan and western Pacific targets | Powerful groundswell with better organization |
| Trade-wind fetch | 8 to 15 feet | 7 to 11 seconds | Small to moderate near exposed coasts | Consistent but short-period |
How North Pacific Swells Influence Hawaii
Hawaii is the best-known receiver of North Pacific swell. The islands sit near the center of the basin — close enough to receive significant size but far enough from the storm track for energy to organize into clean groundswell.
Hawaii Swell Directions and Seasons
The North Shore of Oahu, Maui’s north shore, Kauai, and north-facing Big Island reefs are most exposed to swell from 300° to 360°. West shores respond better to swell from 270° to 320°. The strongest season runs from November through March, with peak consistency in December and January. Typical winter swell periods run 14 to 20 seconds, with exceptional events producing 21 to 23 second forerunners. Surf heights range from fun overhead waves to outer-reef surf well beyond 20 feet on the face, depending on the storm and the break.
Hawaii Swell Quality
Distant storms in the western or central North Pacific usually produce the cleanest surf in Hawaii because the swell arrives without local storm wind. A west-northwest swell favors some reefs while shadowing others behind the islands. A more northerly swell spreads energy differently and may light up breaks that stay smaller on westerly swells.
How North Pacific Swells Influence California
California receives North Pacific swell from autumn through spring. The best direction for any given break depends heavily on coastline orientation and nearby island shadowing.
Northern and Central California Swell Windows
Northern and Central California are open to west, west-northwest, and northwest swell from roughly 270° to 320°. Winter periods commonly range from 12 to 20 seconds, and large storms can produce open-ocean swell heights of 10 feet or more, translating into very large surf at exposed reefs and beaches. Quality improves when the storm is distant and local wind is light or offshore. Close Gulf of Alaska lows can deliver big swell but also bring onshore wind, heavy rain, and shorter-period energy.
Southern California Swell Windows
Southern California is more selective. Point Conception and the Channel Islands block much of the northwest energy, so many breaks need a more westerly winter swell — often around 270° to 295° — to see significant size. Long-period west swells can wrap into select exposures, but some beaches remain shadowed regardless of swell size. The best winter surf often comes when a clean west-northwest swell meets offshore or light wind, and period-sensitive refraction plays a major role in separating good days from great ones.
How North Pacific Swells Influence Oregon and Washington
Oregon and Washington are highly exposed to North Pacific storm energy, receiving powerful west and northwest swell from roughly 250° to 320°. The largest season runs from November through March. Because these coastlines sit closer to the Gulf of Alaska storm track, swell can be very large but also raw. Periods often range from 10 to 17 seconds, with longer-period energy arriving from distant western North Pacific storms. Surf quality improves when high pressure settles over the region and local winds turn light or offshore. Monitoring incoming weather closely is important here — a NOAA weather radio is a practical tool for staying on top of fast-moving Pacific systems when you’re near the water.
How North Pacific Swells Influence Mexico and Central America
Baja California Swell from the North Pacific
Baja California is strongly affected by winter North Pacific swell. West and northwest-facing coastlines can receive swell from 285° to 320° with periods of 12 to 20 seconds. Northern Baja is especially exposed, while southern Baja can receive strong swell wrapping into select reefs and points. Clean desert wind patterns often make Baja an excellent receiver of North Pacific groundswell, particularly when the storm is distant and the swell arrives with long intervals.
Mainland Mexico and Central America
Mainland Mexico and Central America are much more dependent on Southern Hemisphere swell, but North Pacific west-northwest energy can still reach select exposures in winter. The farther south you go, the more the swell angle becomes a limiting factor. West-facing parts of Mexico can see winter pulses, while many south-facing spots receive little from the North Pacific. In Central America, the best-known surf seasons are tied to south and southwest swell, though west or northwest windows can occasionally show North Pacific lines at certain exposures.
How North Pacific Swells Influence Colombia and Ecuador
Colombia and Ecuador can receive North Pacific swell during boreal winter, but it is usually less consistent than Southern Hemisphere swell. The useful directions are generally west-northwest to northwest, roughly 290° to 330°, depending on the coastline and offshore islands. Because these regions sit far from the storm source, only longer-period and well-aimed swells tend to show clearly. Periods of 13 to 18 seconds are most useful. Surf may also run smaller than model maps suggest, since energy spreads significantly over long distances and many coastlines here are oriented more favorably toward southwest swell.
How North Pacific Swells Influence Tahiti and South Pacific Islands
North Pacific swell does cross the equator. There is no physical barrier at the equator that stops swell, but distance, island shadowing, and directional spreading reduce its size considerably. North-facing reefs in French Polynesia, Samoa, Fiji, and the Cook Islands can all receive winter North Pacific swell. The most useful directions are typically north-northwest to north, roughly 315° to 010°, with periods ranging from 14 to 20 seconds. The surf may be modest compared to what Hawaii sees, but it can arrive clean and well organized at exposed reefs.
It is worth separating this from the famous south-southwest swell season at places like Teahupoo. The heaviest Tahitian surf is produced by South Pacific storms, not North Pacific ones. North Pacific swell mainly favors north-facing or northwest-facing setups across the region.
How North Pacific Swells Influence Japan and East Asia
Japan is influenced by several different swell sources. The Pacific-facing coast receives typhoon swell, extratropical low swell, and winter northeast swell. The Sea of Japan side receives strong winter wind swell from the northwest monsoon.
Japan Typhoon Swell
Typhoon season typically runs from late spring into autumn, with peak activity from August through October. Swell directions vary widely depending on storm track — south and southeast swells arrive from systems moving through the Philippine Sea, east swells come from typhoons tracking offshore, and northeast swell can follow recurving storms or extratropical lows east of Honshu. Periods commonly range from 10 to 18 seconds, and a strong recurving typhoon can produce longer-period, higher-quality groundswell. Surf quality depends on the storm’s distance and the direction of local wind.
Japan Winter Swell
In winter, cold air outbreaks over the Sea of Japan create short to medium-period northwest wind swell. On the Pacific side, lows east of Honshu can produce north or northeast swell, usually in the 8 to 15 second range. These events tend to be more local and weather-dependent than long-distance Pacific groundswell, and they can change quickly. Having a reliable handheld marine VHF radio is useful for picking up weather updates when you are away from shore.
How North Pacific Swells Influence Asia and South-East Asia
The western North Pacific is a major swell source for Taiwan, the Philippines, Guam, and parts of eastern China. Typhoons are the most important producers of long-period swell in this region. Taiwan and the Philippines can receive strong east, northeast, or south swell depending on storm position, with periods commonly ranging from 10 to 17 seconds and larger events arriving from recurving typhoons. Guam and Micronesia receive both winter North Pacific swell and tropical cyclone swell, making them highly directional surf destinations.
Much of South-East Asia is partially blocked from open North Pacific swell. Vietnam, Thailand, and much of Indonesia rely more on local monsoon winds, regional storms, or Indian Ocean swell. The South China Sea can produce surf from northeast monsoon bursts and typhoon systems, but these waves are generally shorter-period than open-ocean North Pacific groundswell.
How North Pacific Swells Influence Australia and New Zealand
North Pacific swell has limited influence on Australia and New Zealand compared with Southern Ocean, Tasman Sea, and Coral Sea swell. The distances are extreme, and numerous island chains scatter or block the energy well before it arrives. Very long-period North Pacific swell can occasionally appear on exposed north-facing or northeast-facing coasts after strong winter storms or recurving typhoons, but these events are typically small, inconsistent, and highly selective. For practical forecasting, North Pacific swell is a secondary and rare source for both countries. Local basins and Southern Hemisphere storms are what matter most.
How to Forecast Waves from North Pacific Storms
Forecasting North Pacific swell is a process of matching storm energy to a coastline’s swell window. A massive storm is irrelevant if its fetch points the wrong direction or if islands block the path. Working through the following steps gives you a reliable framework.
Step 1: Identify the Swell Window
Every surf region has a directional window. Hawaii’s north shore likes northwest to north swell. Southern California often needs a more westerly angle. Tahiti’s north-facing reefs need north or north-northwest swell. Japan’s Pacific coast may need east or southeast swell from typhoons. Always confirm that swell direction is measured as the direction the waves are coming from — in surf forecasting, a 315° swell is arriving from the northwest and traveling toward the southeast.
Step 2: Evaluate the Storm Fetch
Look for the strongest wind area on the weather map or wave model. Ask four questions: How strong are the winds? How long is the fetch? How long does the fetch last? And is it aimed at the coastline? A 45-knot fetch aimed directly at Hawaii for 36 hours will often produce better surf there than a 65-knot fetch pointed toward Alaska. Direction is everything. Learning to read these maps well takes practice, and a guide like this nautical chart reference can help sharpen your ability to interpret the ocean environment shown on marine charts and forecast maps.
Step 3: Estimate Swell Period and Arrival Time
Long-period waves travel faster than short-period waves. In deep water, swell group speed is approximately 1.52 times the period in knots. A 20-second swell travels around 30 knots, while a 16-second swell moves at roughly 24 knots. As a rough guide, 20-second swell takes about 33 hours to travel 1,000 nautical miles, and 16-second swell takes about 41 hours. This is why long-period forerunners always arrive first, followed by the main body of the swell at shorter periods.
Step 4: Account for Decay and Shadowing
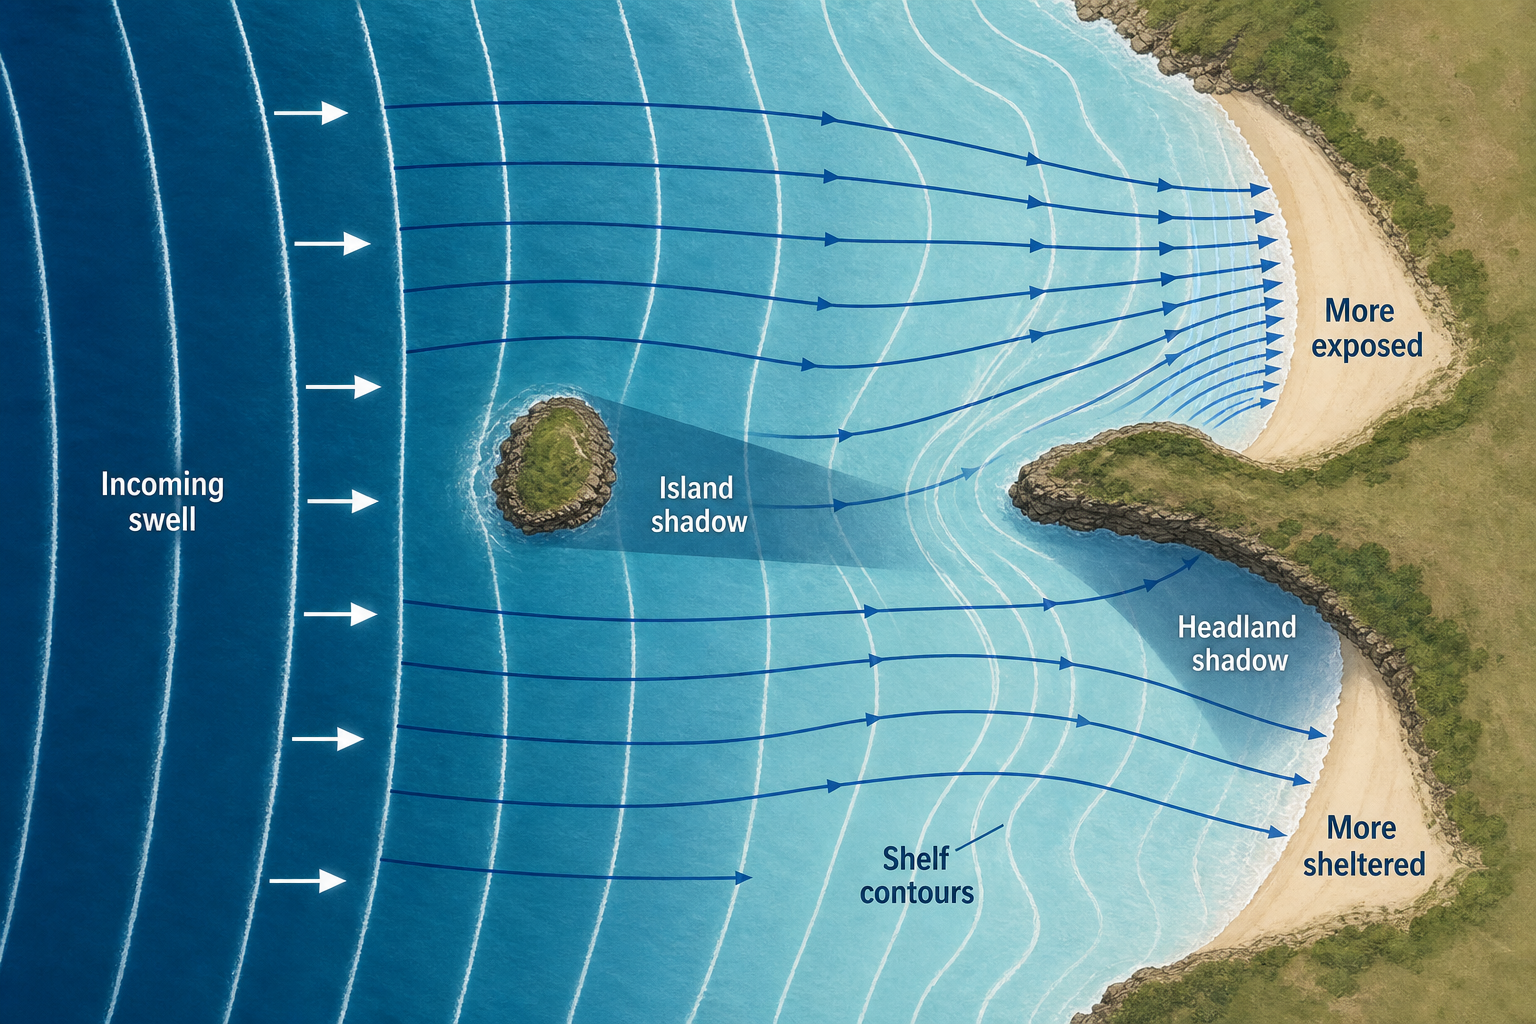
Swell loses height as it spreads away from the storm. Islands, headlands, and continental shelves can further reduce or redirect energy. This is why two beaches just a few miles apart can show very different surf from the same North Pacific swell event. Long-period swell refracts more strongly over underwater topography, focusing energy on certain reefs while bypassing nearby beaches entirely. Local bathymetry often determines whether a swell becomes exceptional or merely average. A coastal navigation chart can give you useful detail on the underwater contours near your local break.
Step 5: Check Buoys and Local Wind
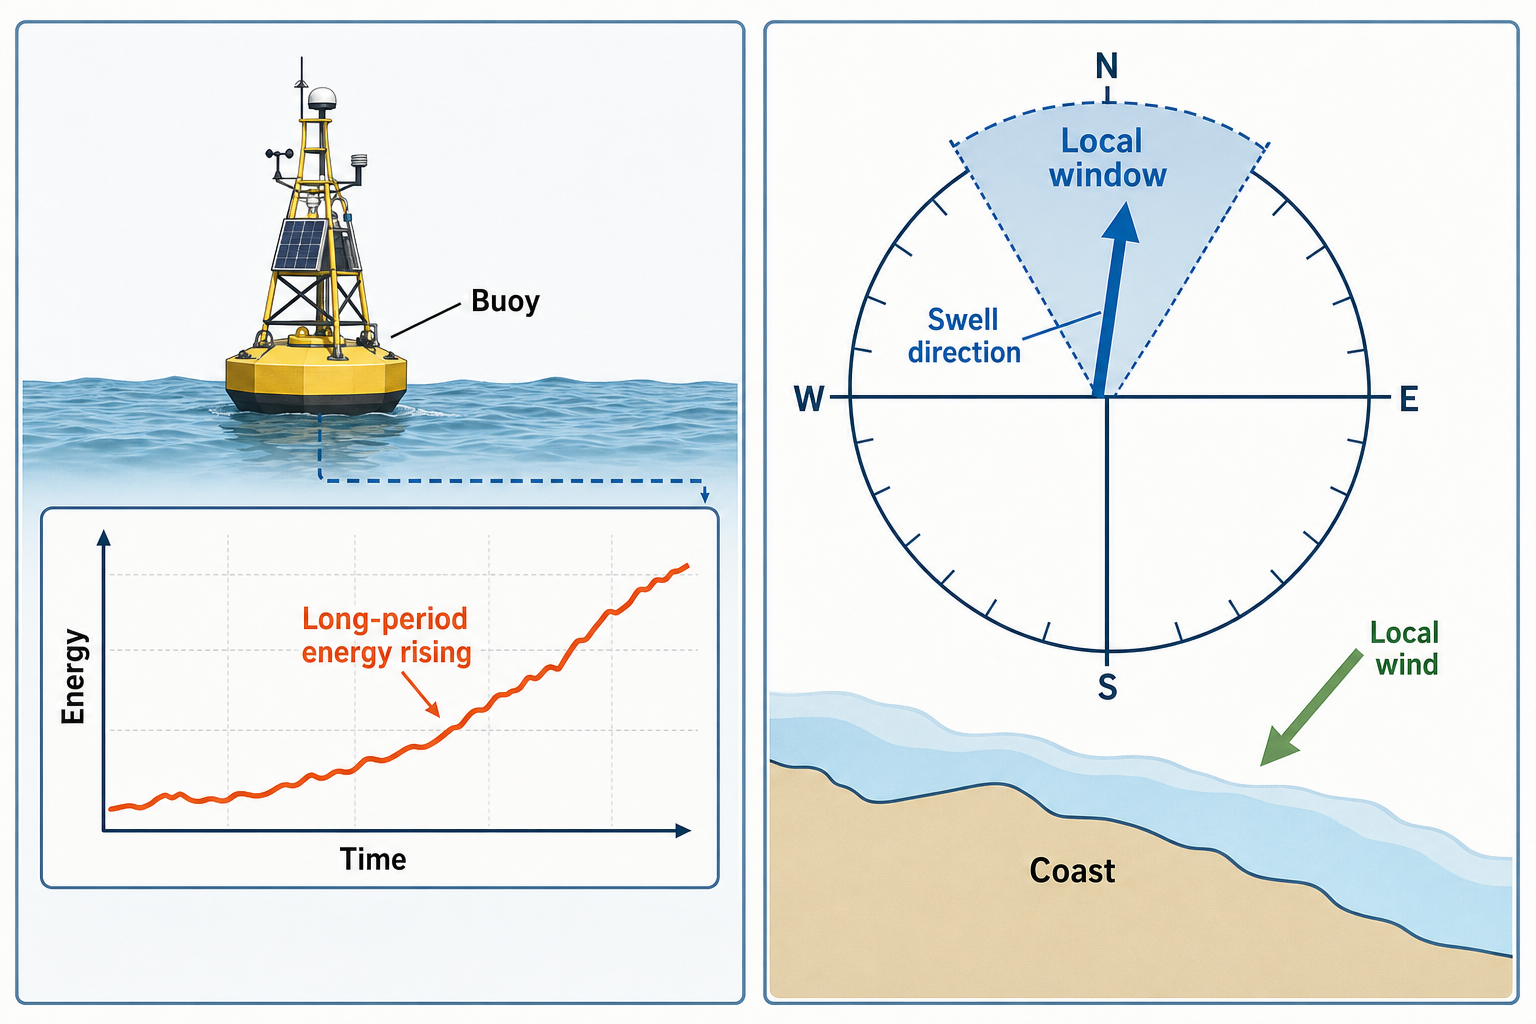
Buoys confirm what the ocean is actually doing. Watch for rising long-period energy in the buoy data before the main swell fills in — directional buoys are especially useful because they show whether the swell is arriving within the local window. Local wind determines the final surf quality. A perfect North Pacific groundswell can be ruined by strong onshore wind, while a modest swell under clean offshore conditions can produce surprisingly fun waves. Tracking wind trends with a wireless weather station or a handheld anemometer helps you time sessions more precisely.
Reading North Pacific Swell Quality Like a Forecaster
High-quality North Pacific swell typically has a clean directional signal, a long period, and enough distance from the storm for the sea state to fully organize. Distant western North Pacific lows often produce better-lined swell than nearby Gulf of Alaska lows, though closer storms can deliver more raw size to the West Coast. Mixed swell can complicate the picture — California may simultaneously see a northwest groundswell, local wind swell, and Southern Hemisphere energy arriving at the same time. Hawaii can see overlapping north and west-northwest pulses. The best surf usually happens when one clean swell dominates and local winds cooperate.
Keeping a consistent log of your sessions alongside swell data is one of the best ways to build forecasting intuition over time. A dedicated surf journal helps you track which swell directions, periods, and tides produce the best results at your local spots. For notes in wet conditions, a waterproof field notebook holds up at the beach or on the water without turning to mush.
North Pacific swell forecasting is ultimately a blend of meteorology and geography. The storm creates the energy, but direction, distance, bathymetry, and local wind decide what actually reaches the lineup. Once you learn to read pressure maps, identify fetch, and understand each region’s swell window, the basin starts to make real sense. A deep low near Japan, a fetch south of the Aleutians, or a recurving typhoon no longer looks like abstract weather data — it becomes a map of future waves moving across the Pacific toward your beach.