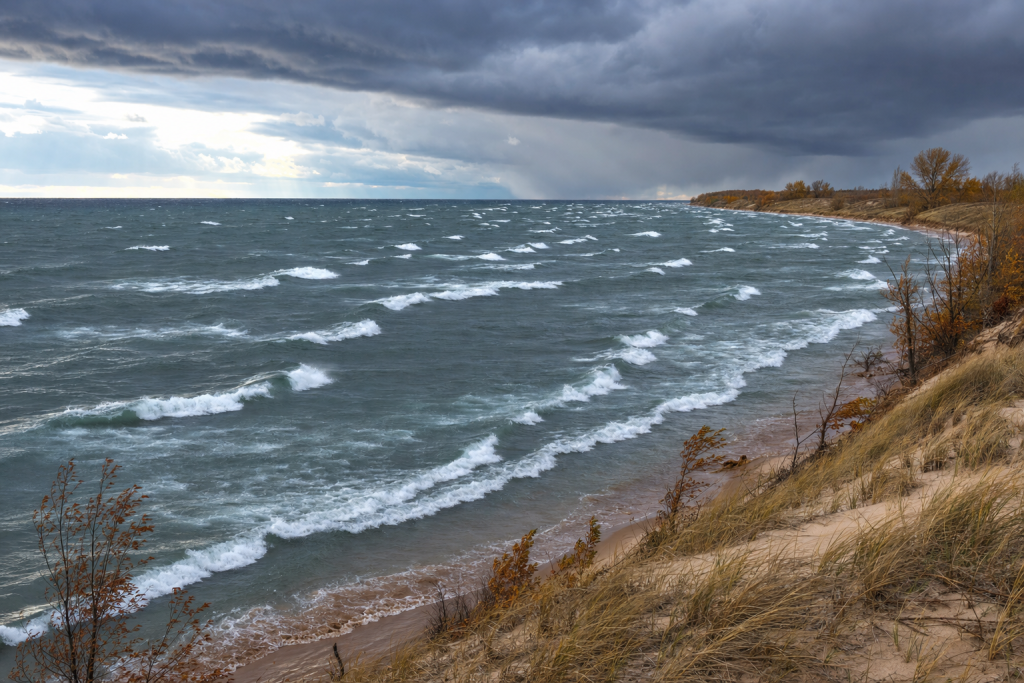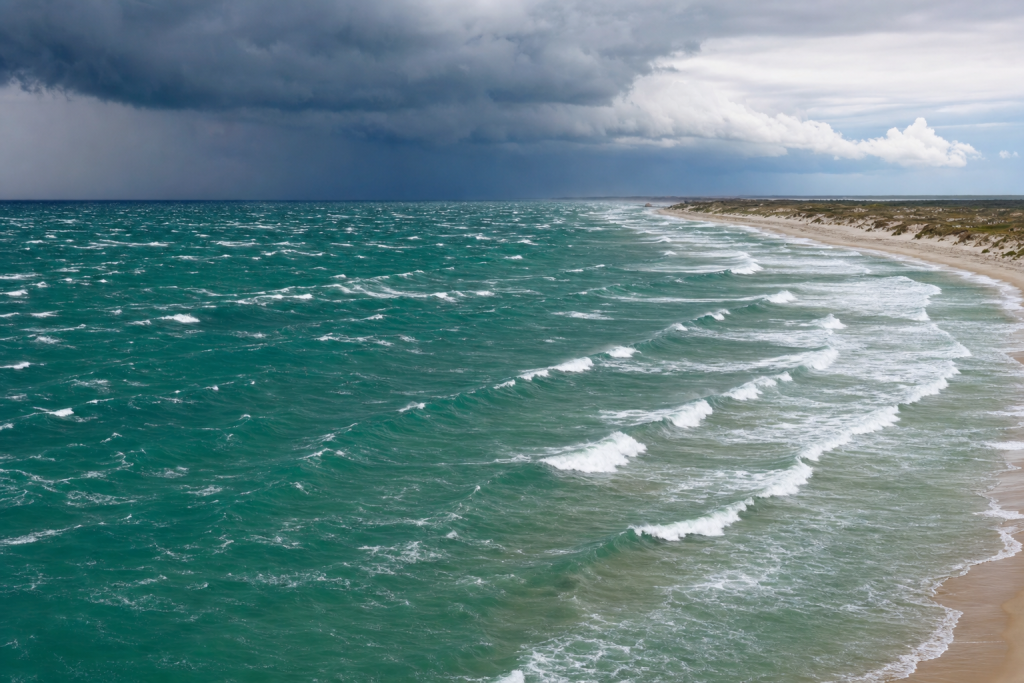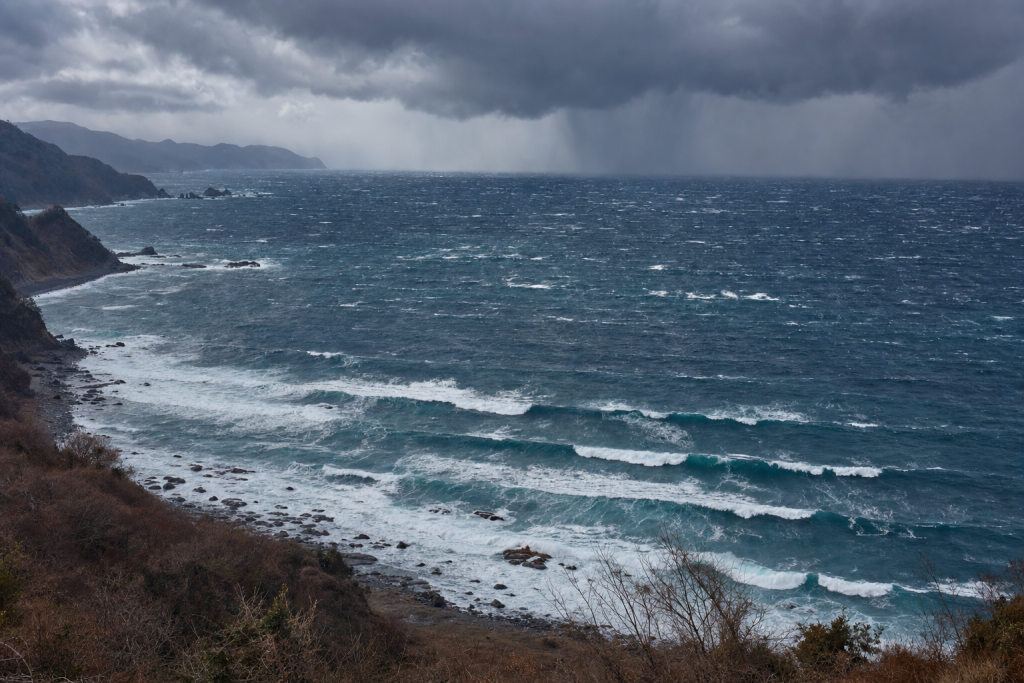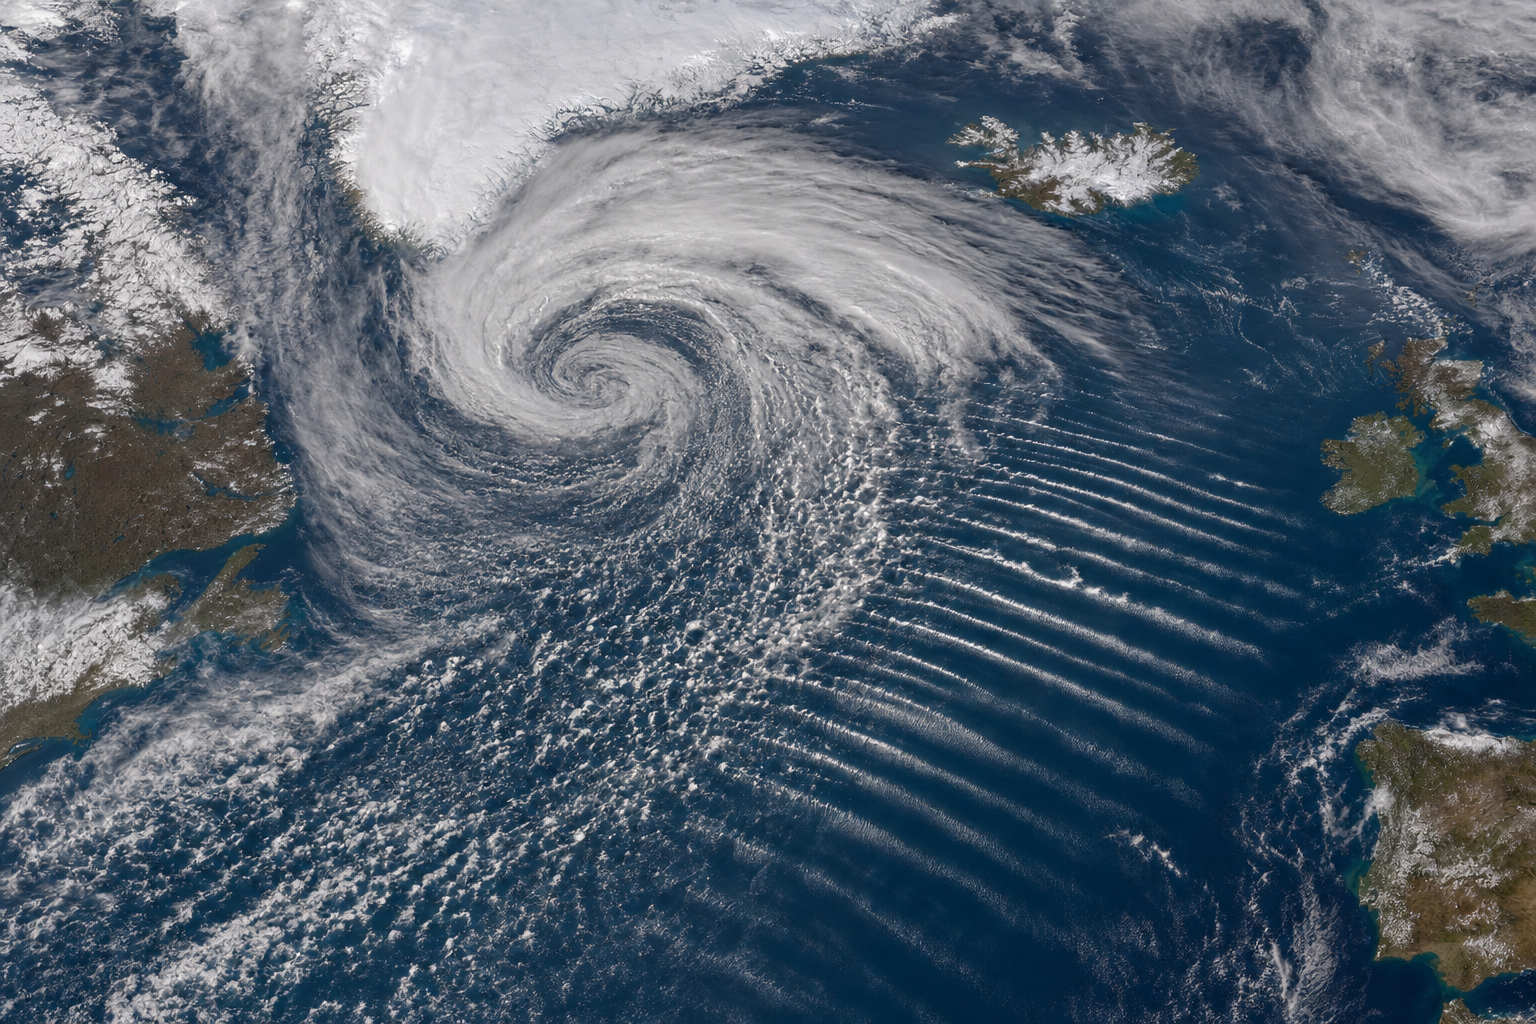
The North Atlantic is a wave-making machine. Storms sit where warm subtropical water meets cold polar air, fast jet streams, and long uninterrupted stretches of open ocean. When the ingredients line up, a single storm can send surf to Ireland, Portugal, Morocco, Puerto Rico, Brazil, and the eastern United States all at once. Understanding how North Atlantic swells are generated helps surfers read weather maps, judge swell quality, and recognize why a deep low near Greenland might mean perfect waves in France but stormy closeouts in Maine. If you want to go deeper on the science behind all of this, this surf forecasting guide is a solid resource for surfers at any level. For the underlying ocean science, this oceanography textbook covers wave physics and ocean circulation in real depth.
North Atlantic Swell Generation Starts With Wind Over Water
Every swell begins as wind energy transferred into the sea surface. The stronger the wind, the longer it blows, and the farther it travels over open water, the larger and more organized the swell becomes.
Wind Speed, Fetch, and Duration
The three core ingredients are:
- Wind speed: Gale-force winds of 34 knots or more can create meaningful surf. Storm-force winds above 48 knots build larger, longer-period swell.
- Fetch: This is the stretch of open ocean over which the wind blows in one consistent direction. A 1,000-nautical-mile fetch aimed at a coastline is far more productive than a compact, disorganized wind field.
- Duration: Winds need time to build seas. A fast-moving storm may look impressive on a map but produce less swell than a slower storm with a steady, well-aimed fetch.
The best swell-producing North Atlantic storms often feature a broad area of 35 to 60-knot winds blowing over a long fetch for 24 to 48 hours. The largest winter lows can generate open-ocean seas of 25 to 50 feet before that energy spreads outward as organized swell. Tracking these patterns becomes much easier when you understand how to interpret pressure charts. This weather terminology reference is a handy companion for anyone learning to read meteorological maps.
Wave Period and Swell Direction
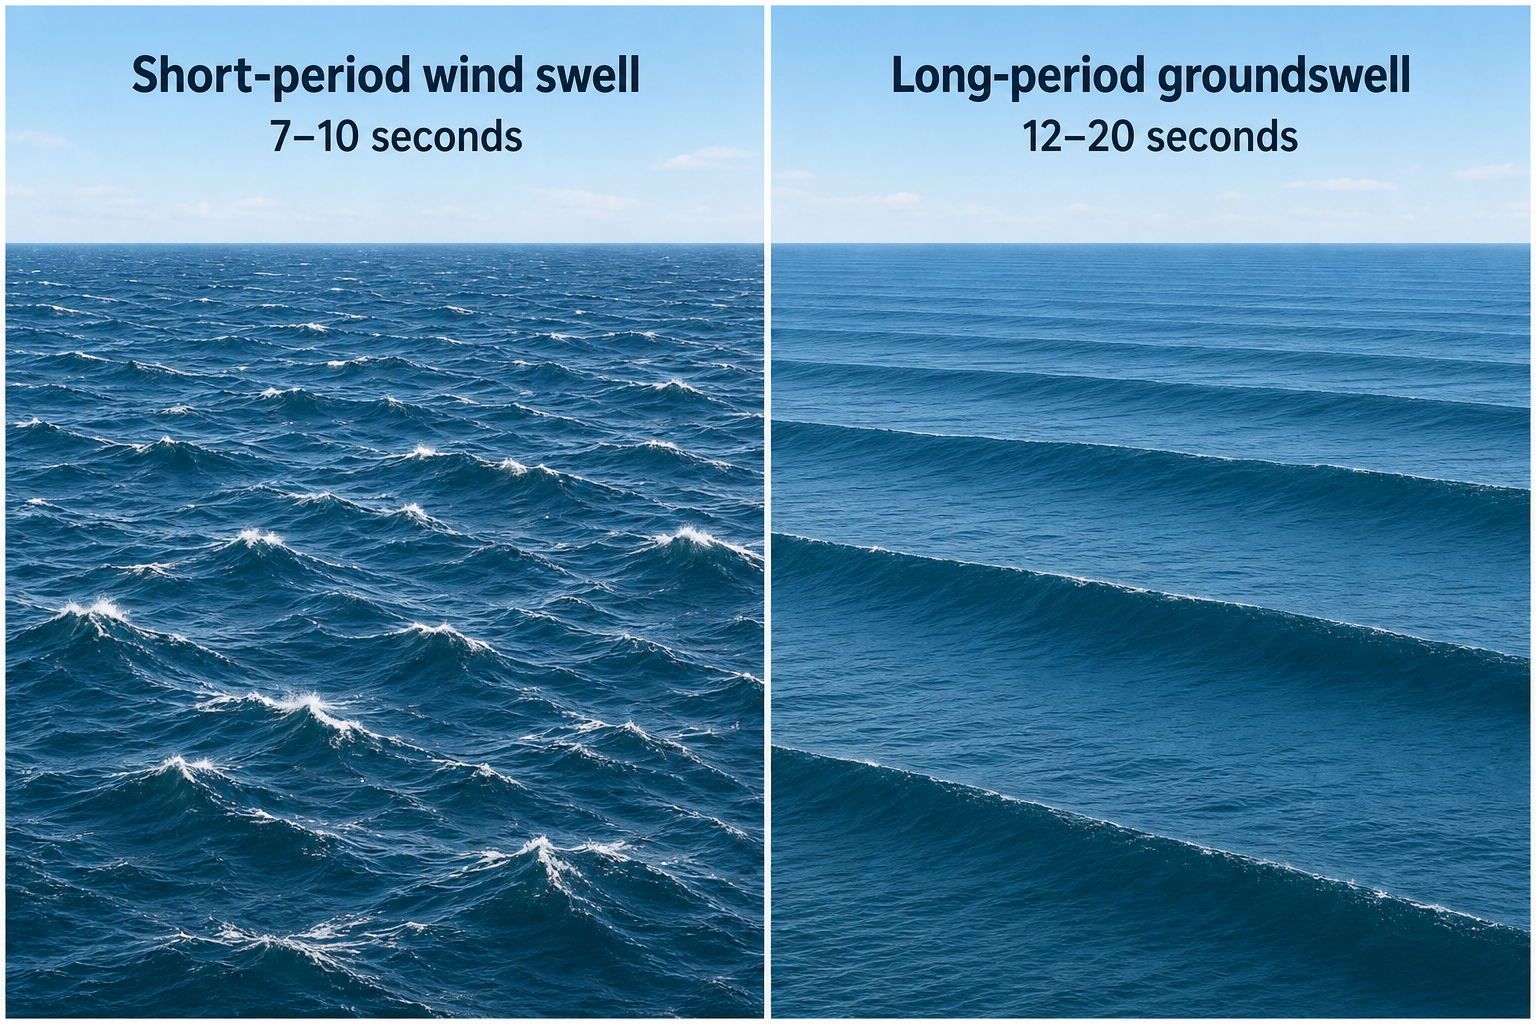
Wave period is the time between successive wave crests. Short-period wind swell, typically 7 to 10 seconds, feels weaker and more chaotic in the water. Long-period groundswell, typically 12 to 20 seconds, travels much farther and refracts more strongly into reefs, points, and beaches.
Swell direction describes where the waves are coming from. A northwest swell moves toward the southeast. A northeast swell moves toward the southwest. This matters because every coastline has a different exposure window. Portugal thrives on northwest swell, New Jersey often prefers east or southeast swell, and Puerto Rico’s north coast is highly receptive to north and northeast swell.
How North Atlantic Swell Travels
Once swell leaves the storm, the longest-period waves move fastest and arrive first. In deep water, swell group speed in knots is roughly 1.5 times the wave period in seconds. A 16-second swell travels at around 24 knots. If the generating storm is 1,200 nautical miles away, the first long-period energy may arrive in about 50 hours.
As swell travels, it disperses. Periods sort themselves out, wave heights decrease, and direction bands narrow. Long-period swell also bends around underwater features more than short-period swell does. That is why canyons, continental shelves, headlands, and island shadows can radically change surf size from one beach to the next — even when those beaches sit just a few miles apart.
North Atlantic Storm Types That Generate Surf
Several distinct storm types generate surf across the North Atlantic. Each carries a different weather-map signature, swell direction, period range, and wave quality. The table below summarizes the main types.
| Storm type | Weather pattern | Typical swell | Surf quality |
|---|---|---|---|
| Extratropical low | Deep low near Newfoundland, Greenland, or the central Atlantic. Central pressure often 950 to 990 millibars. | W to NW swell for Europe. NW to N swell for Morocco, the Canaries, and Senegal. Periods of 12 to 20 seconds. | Powerful and consistent. Quality depends on whether the storm is distant enough to avoid bad local wind. |
| Explosive cyclone | Rapidly deepening low, often near the Gulf Stream or south of Greenland. Pressure can drop more than 24 millibars in 24 hours. | Large long-period groundswell. Exposed surf can reach 10 to 20 feet or more at favored breaks. | Excellent when the fetch is well-aimed and local winds settle. Often too large for exposed beach breaks. |
| Nor’easter or coastal low | Low pressure along the eastern U.S. seaboard with high pressure to the north or northwest. | NE to E swell for Florida through Maine. N to NE swell can reach Puerto Rico and the northern Caribbean. Periods of 8 to 15 seconds. | Stormy while the low is close. Often improves behind the storm when winds turn offshore. |
| Tropical storm or hurricane | Compact warm-core cyclone over warm water, especially from August through October. | E, SE, S, or NE swell depending on storm position and track. Periods of 11 to 18 seconds are common. | Can be clean and long-period when the storm is distant. Size is very sensitive to track and forward speed. |
| Azores High and trade-wind fetch | Strong subtropical high, often 1024 to 1035 millibars, interacting with lower pressure near the tropics or northwest Africa. | NE to E wind swell for the Caribbean, Canary Islands, and Morocco. Periods of 7 to 11 seconds. | Consistent but usually less powerful. Often affected by local trade winds at exposed beaches. |
| Cutoff or subtropical low | Slow-moving low near the Azores, Iberia, or the eastern Atlantic. | Mixed W, SW, N, or NE swell depending on position. Periods of 8 to 14 seconds. | Can create surprising regional pulses, especially for Portugal, Spain, France, and the Canaries. |
Weather Patterns Behind North Atlantic Swell-Producing Storms
Cold Air, Warm Water, and Atmospheric Pressure
The most powerful winter swells usually trace back to extratropical cyclones. These storms form where cold polar air collides with warmer subtropical air. The western North Atlantic is especially active because frigid air pouring off the North American continent flows over the warm Gulf Stream. That sharp temperature contrast strengthens the jet stream and helps surface lows deepen rapidly.
On a weather map, the strongest surf-producing lows are marked by tightly packed isobars. Tight isobars signal a steep pressure gradient, and a steep pressure gradient means stronger sustained winds. A 970-millibar low sitting alongside a 1030-millibar high can generate a vast area of gale or storm-force winds between them. Keeping a marine barometer at home lets you monitor local pressure trends and cross-reference what you’re seeing in the models. A wireless weather station with barometric pressure can give you an even more complete picture of changing conditions.
In winter, sea surface temperatures near the Gulf Stream remain relatively warm while air temperatures drop sharply behind cold fronts. This instability fuels squalls and powerful northwest or north winds. Farther east, lows near Iceland and the Norwegian Sea can maintain long west-to-east fetches aimed directly at Europe.
The Icelandic Low, Azores High, and North Atlantic Oscillation
Two semi-permanent pressure features shape the basin: the Icelandic Low in the north and the Azores High in the subtropics. When the pressure difference between them is strong, westerly winds across the North Atlantic intensify. This pattern tends to favor frequent swell for Ireland, the United Kingdom, France, and northern Spain.
When the storm track shifts south, Portugal, Morocco, Western Sahara, and the Canary Islands often receive more direct swell exposure. A more blocked or sluggish pattern can also produce slower-moving lows, which may improve swell duration when the fetch is aimed at land.
What North Atlantic Surf Storms Look Like on a Weather Map
A strong surf storm is more than just a low-pressure number. The shape and alignment of the wind field matter most. The best maps show:
- A deep low marked by a clear “L” with tightly packed isobars radiating outward.
- A broad fetch of 30 to 60-knot winds pointed toward the target coastline.
- Cold, warm, and occluded fronts wrapping around the low center.
- A comma-shaped cloud shield on satellite imagery for mature extratropical lows.
- A compact circular cloud mass with a warm core for hurricanes and tropical cyclones.
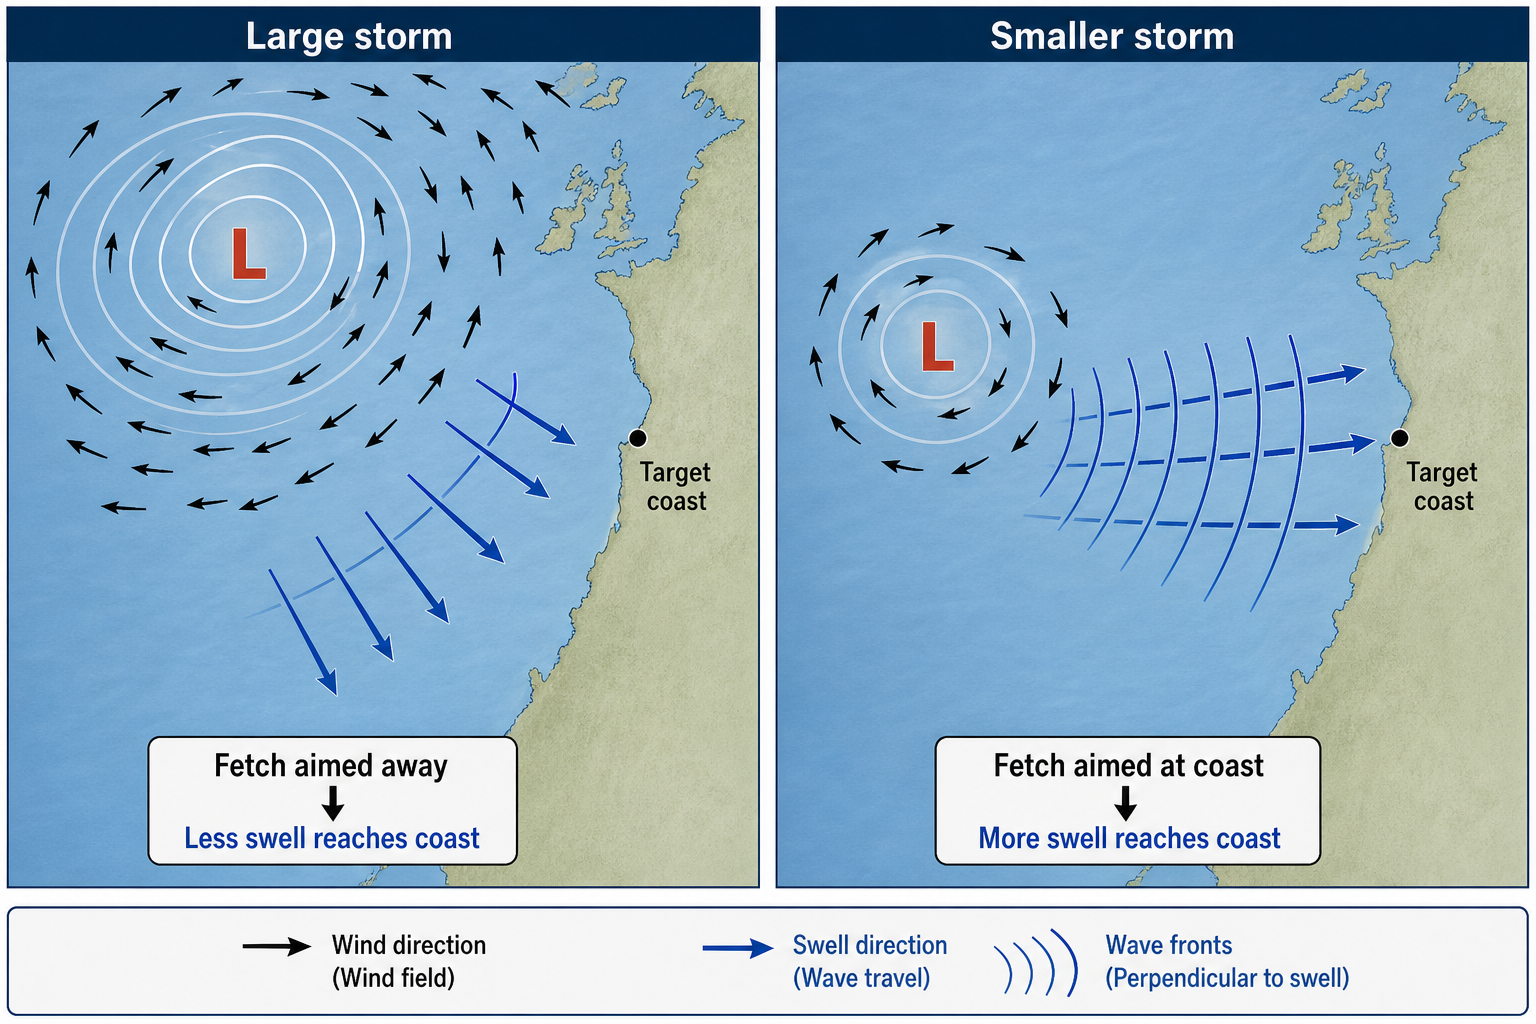
For surf forecasting, the single most important detail is fetch alignment. A massive storm aimed away from the coast may produce surprisingly little surf at your local break. A smaller, well-positioned storm with a fetch aimed directly at land can produce excellent waves. Learning to read nautical and meteorological charts is a skill worth developing. This chart reading guide walks through how to interpret both paper and electronic charts clearly. A coastal navigation chart is also useful for understanding the bathymetric features that shape swell as it approaches the shore.
Seasonal North Atlantic Swell Patterns and Wave Quality
Season controls storm type, swell direction, and overall wave quality. The size ranges below describe typical exposed surf, not maximum storm surf. Local bathymetry can make specific spots significantly larger or smaller than the open-ocean numbers suggest.
| Season | Main swell sources | Typical directions | Wave heights and periods | Wave quality |
|---|---|---|---|---|
| Winter December to February |
Deep extratropical lows, nor’easters, cold fronts. | W to NW for Europe. N to NW for northwest Africa. NE to E for the U.S. East Coast. N to NE for Puerto Rico and the Caribbean. | Exposed surf commonly 4 to 15 feet. Major zones can exceed 20 feet. Periods often 12 to 20 seconds. | The biggest season overall. Quality is high when local winds are offshore, but many exposed coasts are frequently stormy. |
| Spring March to May |
Weakening Atlantic lows, late nor’easters, trade-wind fetch. | W to NW in Europe. N to NE in the subtropics. E to NE on parts of the U.S. East Coast. | Surf often 2 to 8 feet. Periods usually 8 to 16 seconds. | More manageable than winter. Winds become more variable, so clean windows open up more frequently. |
| Summer June to August |
Azores High trades, weak frontal lows, early tropical systems. | NE trade swell in the tropics. Small NW pulses for Europe. E to SE tropical swell for the western Atlantic. | Surf often 1 to 5 feet. Tropical swells can reach 4 to 10 feet with 12 to 17-second periods. | Generally the smallest season. Sea breezes and trade winds often affect exposed beaches during daylight hours. |
| Autumn September to November |
Recurving hurricanes, first strong extratropical lows, early nor’easters. | W to NW for Europe. N to NW for Africa. E, SE, or NE for the U.S. East Coast. N to NE for the Caribbean. | Surf commonly 3 to 12 feet. Periods often 10 to 18 seconds. | Often the best balance of swell size and local conditions, especially across Europe and the western Atlantic. |
North Atlantic Swell in the United Kingdom, Ireland, and Atlantic Europe
Western Europe receives some of the most consistent North Atlantic groundswell anywhere on the planet. The primary storm zone sits between Newfoundland, Greenland, Iceland, and the central North Atlantic. Swells generally arrive from the west or northwest, then refract over broad continental shelves and into bays and inlets.
| Region | Best swell directions | Typical surf and periods | Seasonal quality |
|---|---|---|---|
| United Kingdom | W to NW for Cornwall, Wales, and western Scotland. N swell for northern Scotland. | Winter exposed surf often 4 to 12 feet. Major storms can be much larger. Periods range from 10 to 18 seconds. | Most consistent in autumn and winter. Sheltered reefs and beaches handle the strongest wind events best. |
| Ireland | W, WNW, and NW. Some reefs also handle SW swell well. | Winter surf commonly 6 to 15 feet at exposed coasts, with bigger big-wave days possible. Periods of 12 to 20 seconds are common. | Very consistent but highly wind-exposed. Quality improves significantly with easterly or southeasterly local wind. |
| France | W to NW for Brittany and the Bay of Biscay coast. | Autumn and winter surf often 3 to 10 feet. Periods commonly 10 to 16 seconds. | Autumn is often the prime season because sandbars can be well-shaped and winds are less harsh than midwinter. |
| Spain | NW to W for Galicia, Asturias, Cantabria, and the Basque Country. | Surf often 3 to 10 feet in winter. Periods range from 10 to 17 seconds. | The north coast is highly consistent from autumn through spring. The Bay of Biscay can focus or partially block incoming energy. |
| Portugal | NW to W for the west coast. SW to W for parts of the Algarve. | West coast surf commonly 3 to 12 feet from autumn through spring. Strong swells carry periods of 14 to 20 seconds. | Autumn is often the cleanest season. Winter brings the largest surf, including canyon-focused waves at Nazaré. |
North Atlantic Swell in Morocco, Western Sahara, the Canary Islands, and Senegal
Northwest Africa sits downstream of the main North Atlantic storm track. Long-period swell from winter lows often arrives from the north or northwest, while the Azores High and regional pressure gradients generate shorter-period northeast trade-wind swell year-round. A good world atlas helps visualize how storm systems track across the basin relative to these coastlines.
| Region | Best swell directions | Typical surf and periods | Seasonal quality |
|---|---|---|---|
| Morocco | NW to N. Some pointbreaks prefer a more northerly angle. | Surf commonly 3 to 10 feet from autumn through spring. Periods of 12 to 18 seconds are frequent. | Best in autumn and winter with light easterly wind. Long right points can organize distant North Atlantic swell into exceptional surf. |
| Western Sahara | N to NW groundswell, plus NE trade-wind swell. | Surf often 2 to 8 feet. Groundswell periods reach 12 to 17 seconds, while trade swell sits around 8 to 11 seconds. | Consistent but wind-prone. Protected points and leeward setups handle trade winds best. |
| Canary Islands | NW, N, and NNE. Island shadowing is critically important for finding surf. | North-facing reefs commonly see 3 to 10 feet in winter. Periods range from 10 to 18 seconds. | Winter produces the most powerful surf. Summer is smaller and dominated by NE trade winds. |
| Senegal | N to NW groundswell, with shorter NNE trade swell also present. | Surf often 2 to 8 feet from late autumn through spring. Periods usually range from 9 to 16 seconds. | Best during the dry season when winds turn favorable. Long-period North Atlantic swell can travel far enough south to produce quality surf at right-hand points. |
North Atlantic Swell in Puerto Rico, the Caribbean, Brazil, and the U.S. East Coast
The western Atlantic draws surf from a different mix of storm types. Winter coastal lows and nor’easters produce northeast and east swell for the United States. Large winter lows farther north send north swell into Puerto Rico and the Caribbean. Tropical storms and hurricanes add long-period pulses from late summer into autumn. A NOAA weather alert radio is worth having at home during active storm periods, and a handheld VHF marine radio with weather alerts is useful when you’re already out near the water.
| Region | Best swell directions | Typical surf and periods | Seasonal quality |
|---|---|---|---|
| Puerto Rico | N to NE in winter. E to SE from tropical systems and trade swell. | North coast surf often 3 to 10 feet in winter. Periods range from 9 to 17 seconds. | Best from November through March for north swell. Hurricane season can produce strong but less predictable surf. |
| Caribbean Islands | N to NE for north-facing coasts. E trade swell is common year-round. Hurricane swell can arrive from E, SE, or S. | Surf often 2 to 8 feet. Trade swell periods are usually 7 to 10 seconds. Groundswell is often 11 to 16 seconds. | Winter north swells are cleaner and more powerful. Island shadowing creates major size differences over short distances. |
| Brazil | N to NNE for northern and northeast Brazil. NE to E trade swell is also common. | Northern exposures can see 2 to 6 feet from North Atlantic swell, often at 10 to 16 seconds. | Most North Atlantic influence occurs from December through March. Much of eastern and southern Brazil depends more on South Atlantic storm systems. |
| Florida | NE to E from nor’easters and trade fetch. E to SE from hurricanes. North Florida also receives NNE swell. | Surf often 2 to 8 feet. Periods range from 8 to 15 seconds, with longer tropical pulses possible. | Autumn and winter are most productive. The Bahamas block some northerly energy for southeast Florida. |
| North Carolina | NE, E, SE, and S. The Outer Banks have a very wide swell exposure window. | Surf commonly 3 to 10 feet during strong events. Periods range from 8 to 16 seconds. | Autumn is often excellent due to hurricanes and early fronts. Winter nor’easters can be powerful but are very wind-sensitive. |
| Delaware | E to SE, with some NE swell reaching certain sandbar and inlet exposures. | Surf often 2 to 8 feet during storm events. Periods are commonly 8 to 14 seconds. | Best with offshore winds behind cold fronts or after coastal lows push through. |
| New Jersey | E, SE, and NE. | Surf often 2 to 10 feet during strong nor’easters or hurricane swells. Periods range from 8 to 15 seconds. | Autumn is a prime season. Winter can be excellent when winds switch offshore after a departing storm. |
| New York | E, SE, and NE for Long Island and the Rockaways. | Surf often 2 to 10 feet during strong events. Periods range from 8 to 15 seconds. | Best during hurricane season and postfrontal winter windows. Sand movement strongly influences wave quality. |
| Massachusetts | NE to E for many breaks. SE swell affects exposed outer coast areas. | Surf often 2 to 10 feet. Periods range from 8 to 16 seconds. | Nor’easters are the major producers. Cape Cod is highly exposed, while other areas depend heavily on swell direction and island shadowing. |
| Maine | E to NE, with SE swell reaching some exposed zones. | Surf often 2 to 8 feet during strong events. Periods usually range from 8 to 14 seconds. | Winter and autumn are most consistent. The Gulf of Maine filters some swell but can focus energy at reefs and points. |
How to Forecast Waves From North Atlantic Storms
Step 1: Find the Storm and Identify the Fetch
Start with a surface pressure chart and wind map. Locate the low, then identify the strongest winds blowing over open water. The fetch must be aimed toward the target coast. For Europe and northwest Africa, the best fetch is usually on the southern or western side of lows near Greenland, Iceland, or the central Atlantic. For the U.S. East Coast, the best fetch typically comes from northeast or east winds wrapping around coastal lows, nor’easters, or offshore hurricanes. A handheld anemometer lets you measure local wind speed at the beach to compare with what the models are showing.
Step 2: Match Swell Direction to the Coast
Use great-circle direction rather than a flat-map estimate. Ireland and the United Kingdom are open to W and NW energy. Portugal, France, and northern Spain typically favor W to NW swell. Morocco, the Canaries, Western Sahara, and Senegal often prefer N to NW swell. The U.S. East Coast generally needs NE, E, or SE swell depending on the state and local exposure. Puerto Rico, the northern Caribbean, and parts of Brazil respond well to N and NE swell from large North Atlantic storms.
Step 3: Estimate Period, Arrival Time, and Size
Long, strong fetches create longer periods. A mature winter low can send 14 to 20-second swell across the basin. A shorter-lived coastal low may produce 8 to 13-second swell. Trade-wind fetch is commonly 7 to 11 seconds.
For arrival time, use this simple deep-water estimate:
Travel time in hours = distance in nautical miles ÷ (1.5 × swell period in seconds)
For example, a 15-second swell travels at about 22.5 knots. From a storm 1,000 nautical miles away, the first energy may arrive in roughly 44 hours. The longest-period forerunners always arrive first, followed by the more consistent main swell. Keeping a waterproof field notebook is a practical way to log storm positions, buoy readings, and arrival times so you can refine your personal forecasting over time. A dedicated surf log book works well for recording swell conditions alongside session notes.
Step 4: Judge Swell Quality
Storm strength creates swell, but local wind determines quality. A perfect groundswell can be completely ruined by onshore wind. In western Europe, high pressure building over land or light easterly flow often cleans up Atlantic swell. In Morocco, an easterly or northeasterly land wind is favorable for many pointbreaks. On the U.S. East Coast, surf typically improves after a cold front passes and winds turn west or northwest.
Bathymetry matters just as much as wind. Long-period swell can double in size at a focusing reef, fade completely behind an island, or close out on a straight sandbar. Always compare offshore swell model data with nearby buoy readings and local reports before making the call to paddle out.
Step 5: Use Buoys to Confirm the Forecast
Buoys reveal whether a storm produced what the models predicted. Watch for a rising long-period signal before the main swell fills in. If a buoy west of Ireland jumps from 10 seconds to 17 seconds, the leading groundswell is entering the continental shelf. If a buoy off the Mid-Atlantic shows building 12-second east swell, beach breaks from Delaware to New York may be next in line.
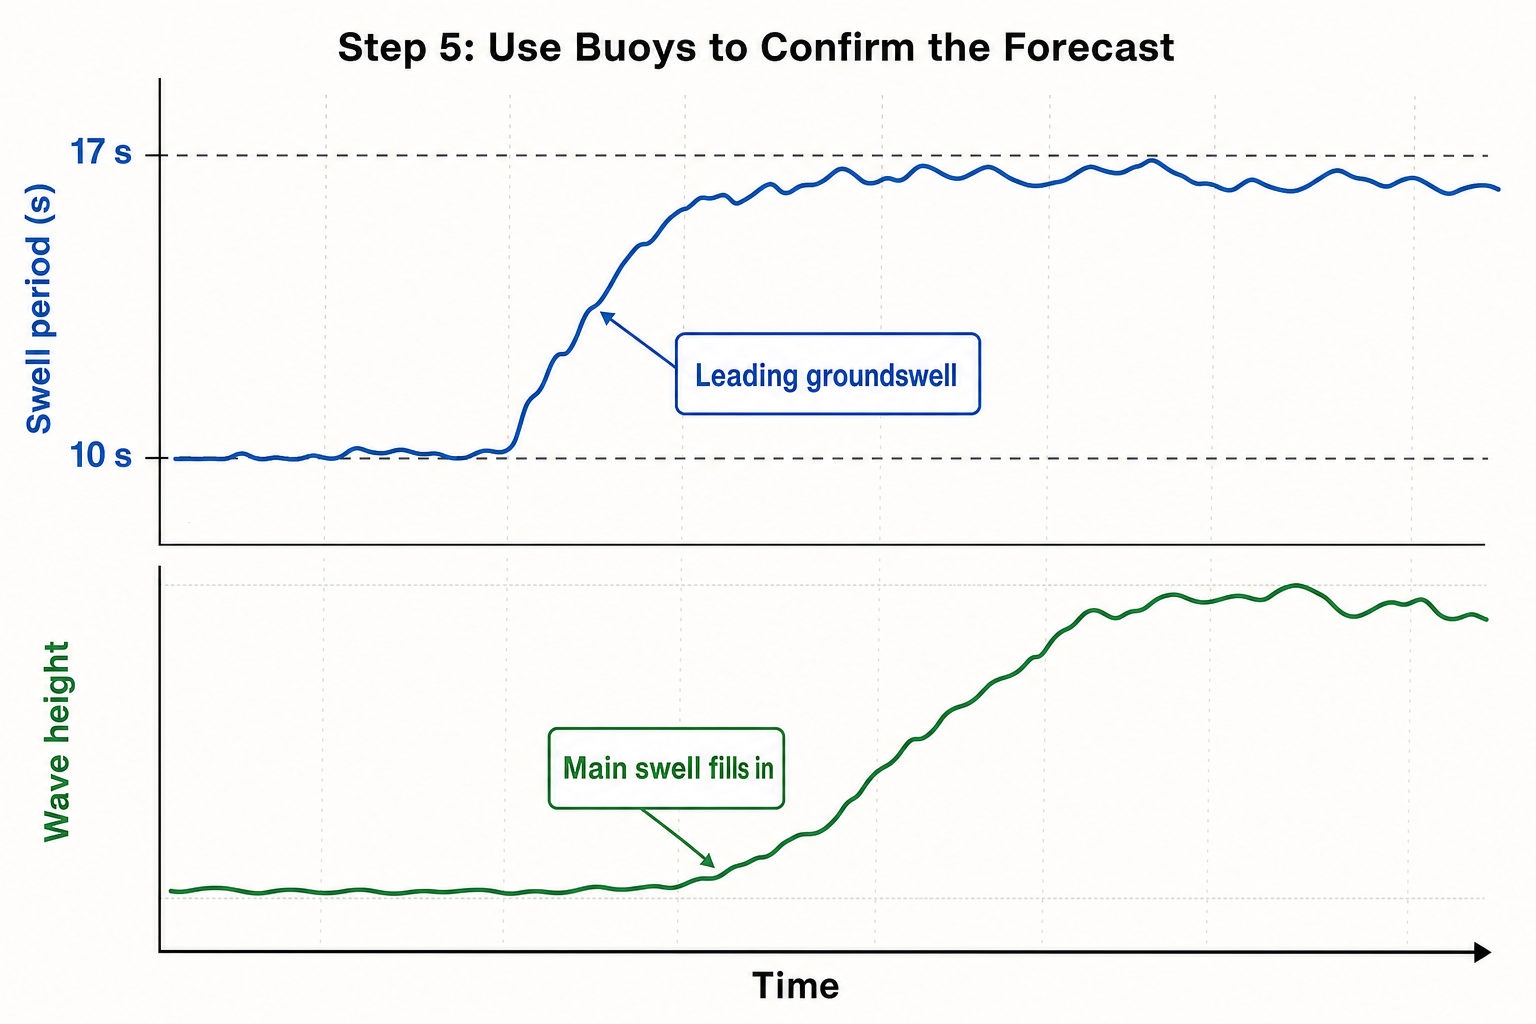
Check the directional spectrum when it is available. A buoy can show mixed seas — for example, short-period local wind swell layered on top of longer-period groundswell. The longer-period component is almost always the one that produces the most powerful and rideable surf. Having a waterproof map case is useful for protecting printed charts and buoy data when you are checking conditions at the beach in wet weather.
North Atlantic swell generation is a blend of meteorology, ocean physics, and local coastline detail. Deep winter lows, nor’easters, hurricanes, and trade-wind patterns each produce a different kind of surf, and every coastline responds in its own way. The more carefully you read storm position, fetch alignment, swell period, local wind, and bathymetry together, the easier it becomes to turn a weather map into a reliable surf forecast — and to be in the right place when the ocean delivers.