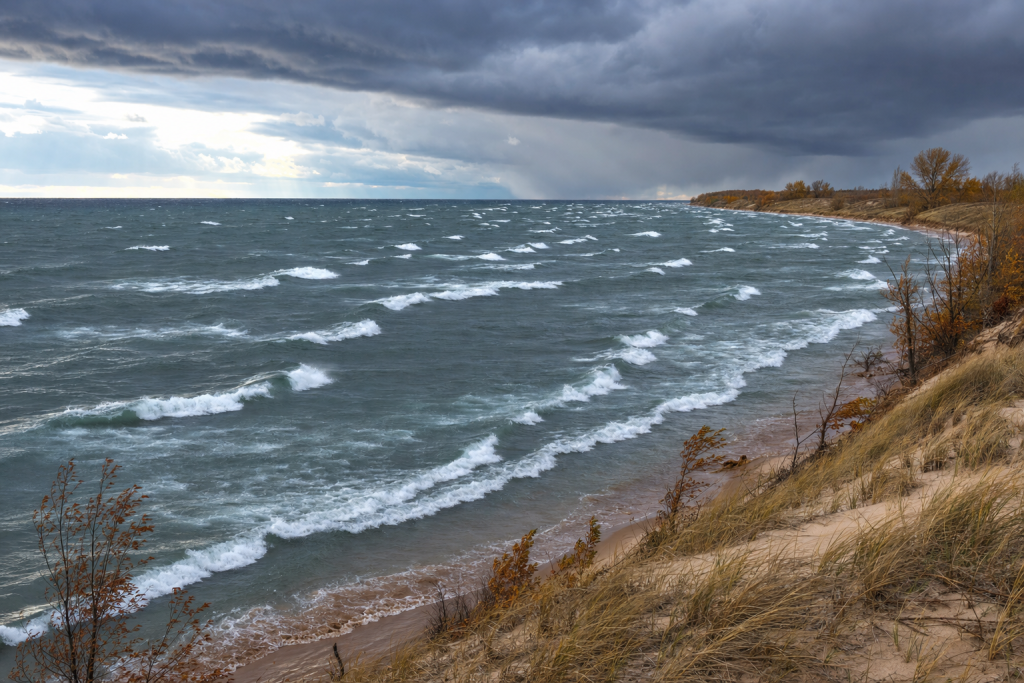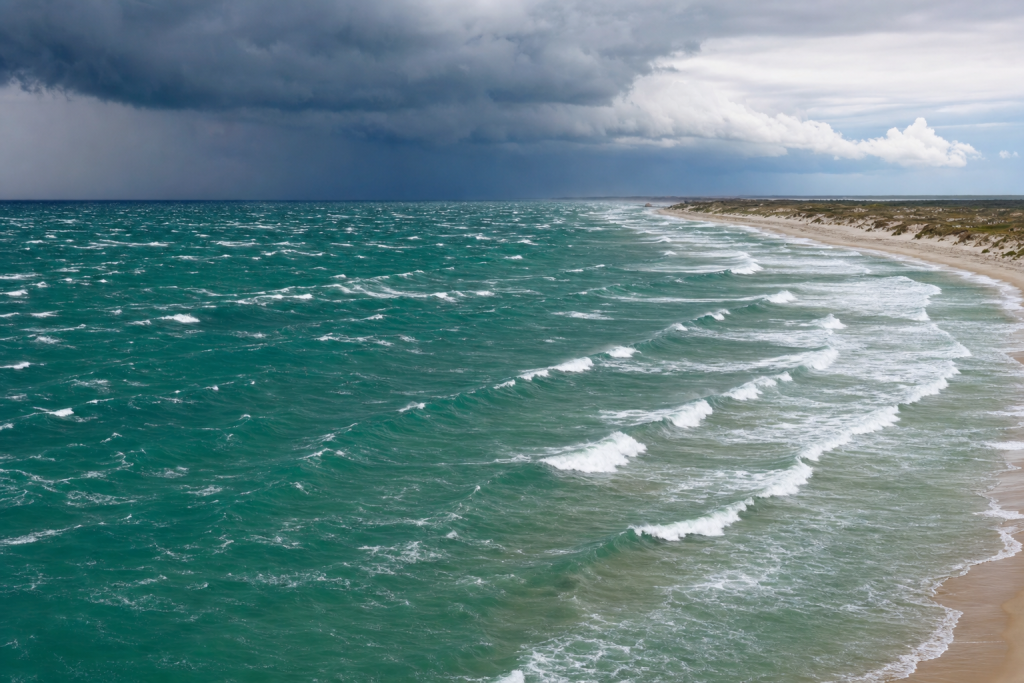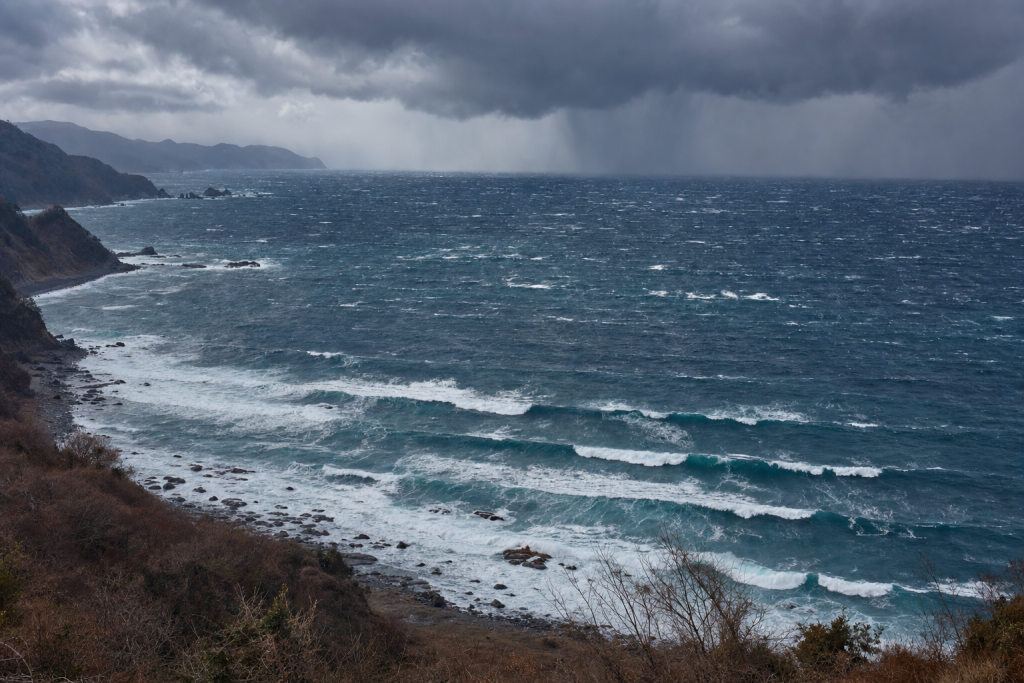
The South Atlantic is one of surfing’s most underappreciated swell engines. It doesn’t get the same attention as the North Atlantic hurricane corridor or the North Pacific winter storm track, yet it sends waves into Brazil, Namibia, South Africa, parts of the Caribbean, and even the U.S. East Coast. If you want to understand how it all works, this surf forecasting guide is a great starting point. The key is learning which South Atlantic storms have the right wind strength, fetch, duration, and direction to send organized swell toward a particular coastline. Picking up a solid oceanography reference can also help you build a deeper understanding of how storm energy moves through the ocean.
How South Atlantic Swell Is Generated
All swell starts with wind blowing over water. The stronger the wind, the longer it blows, and the larger the area it covers, the more energy transfers into the ocean. In the South Atlantic, the best surf-producing systems are usually mid-latitude storms, cold fronts, cutoff lows, and persistent trade-wind patterns around the South Atlantic High.
Wind Speed, Fetch, and Duration
Three ingredients determine the size and period of a South Atlantic swell:
- Wind speed: Gales of 30 to 45 knots can produce solid regional swell. Storm-force winds above 50 knots can generate long-period groundswell.
- Fetch: A short fetch creates peaky, shorter-period waves. A fetch stretching 600 to 1,500 kilometers can produce much more organized swell.
- Duration: A wind field that stays aimed at a coastline for 24 to 72 hours produces far better surf than a fast-moving burst of wind.
When all three ingredients line up, storm seas inside the fetch can reach 20 to 45 feet or more. By the time that energy reaches surf zones, it has spread out, lost height, and organized into cleaner wave groups. Understanding that process is easier with a good weather terminology reference on hand.
Swell Period and Travel Time
Wave period is one of the best clues to a swell’s origin. Short-period waves of 6 to 9 seconds usually come from local wind or trades. Regional storms commonly produce 9 to 14 second swell. Strong Southern Ocean or South Atlantic lows can send 15 to 22 second groundswell across entire ocean basins.
Long-period swell travels faster than short-period swell. In deep water, group speed is roughly:
Travel speed in kilometers per day ≈ 67.4 × wave period in seconds
A 16 second swell travels about 1,080 kilometers per day. A 20 second swell travels about 1,350 kilometers per day. That means a strong South Atlantic groundswell may reach Brazil in a few days, Namibia or South Africa in two to five days, and the Caribbean or U.S. East Coast in roughly a week or more.
South Atlantic Storm Types
Extratropical Lows and Cold Fronts
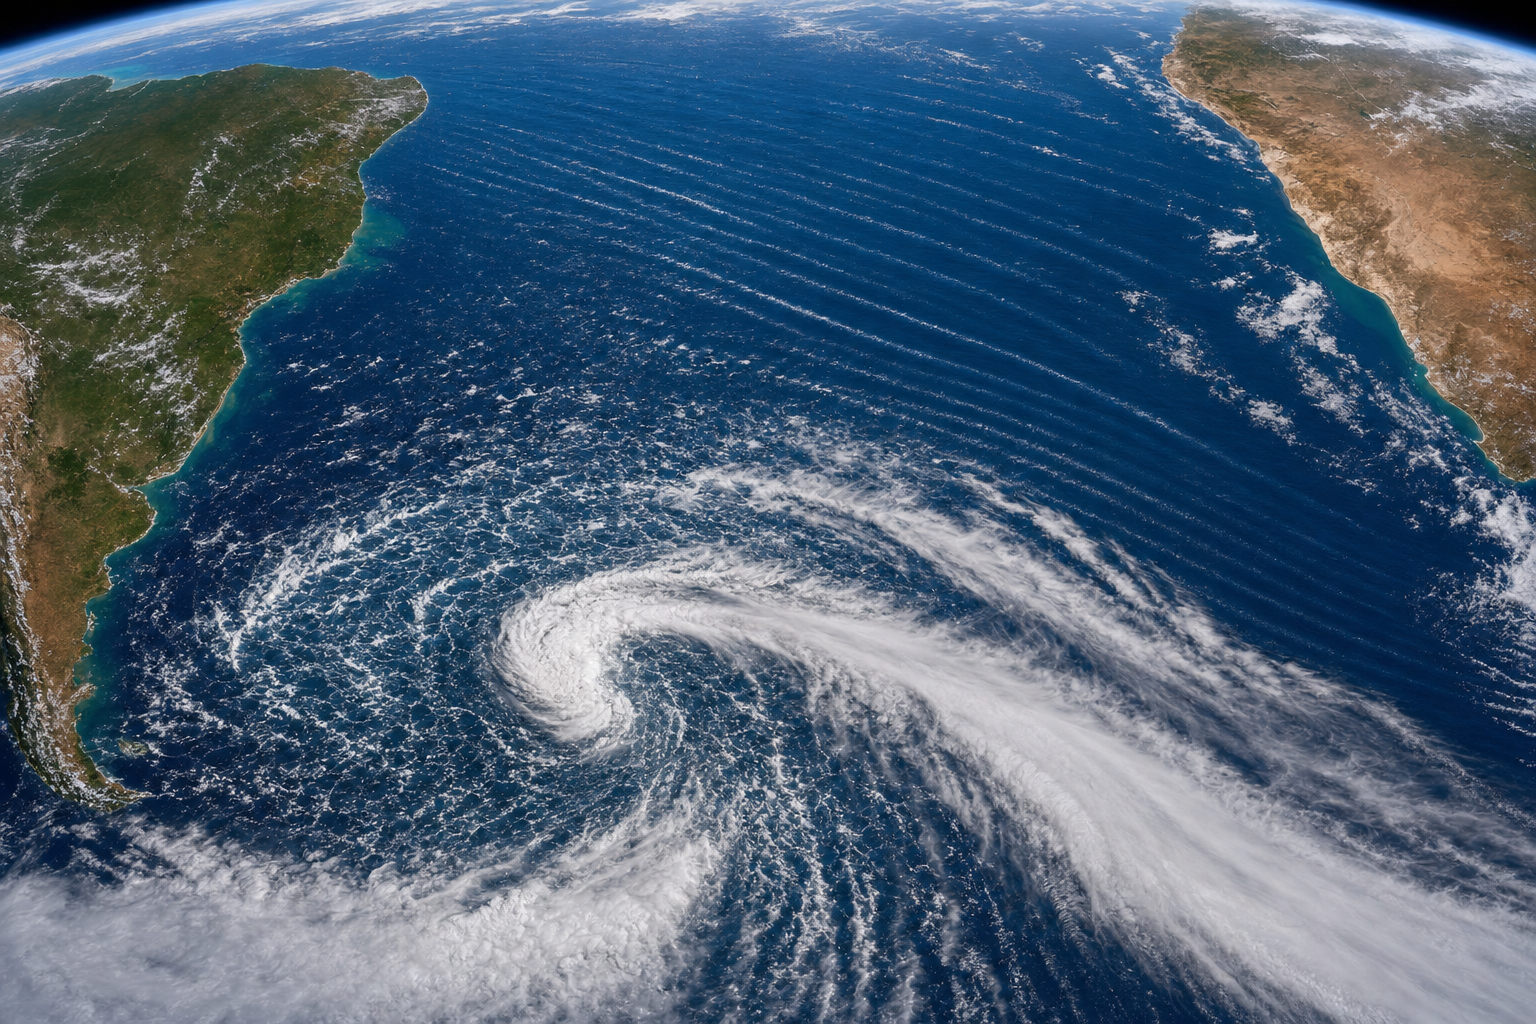
The most reliable South Atlantic swell makers are extratropical lows tied to cold fronts. These storms form where cold Antarctic air meets warmer subtropical air, often between 35°S and 60°S. The temperature contrast strengthens the jet stream, drops atmospheric pressure, and creates large areas of gale-force wind.
On a weather map, these storms appear as a low-pressure center with closed isobars and a trailing cold front. In the Southern Hemisphere, air circulates clockwise around low pressure. The best swell-producing winds are found where tightly packed isobars create a long fetch aimed at the target coast. Keeping a waterproof field notebook handy is useful when you’re reading charts and want to track patterns over time.
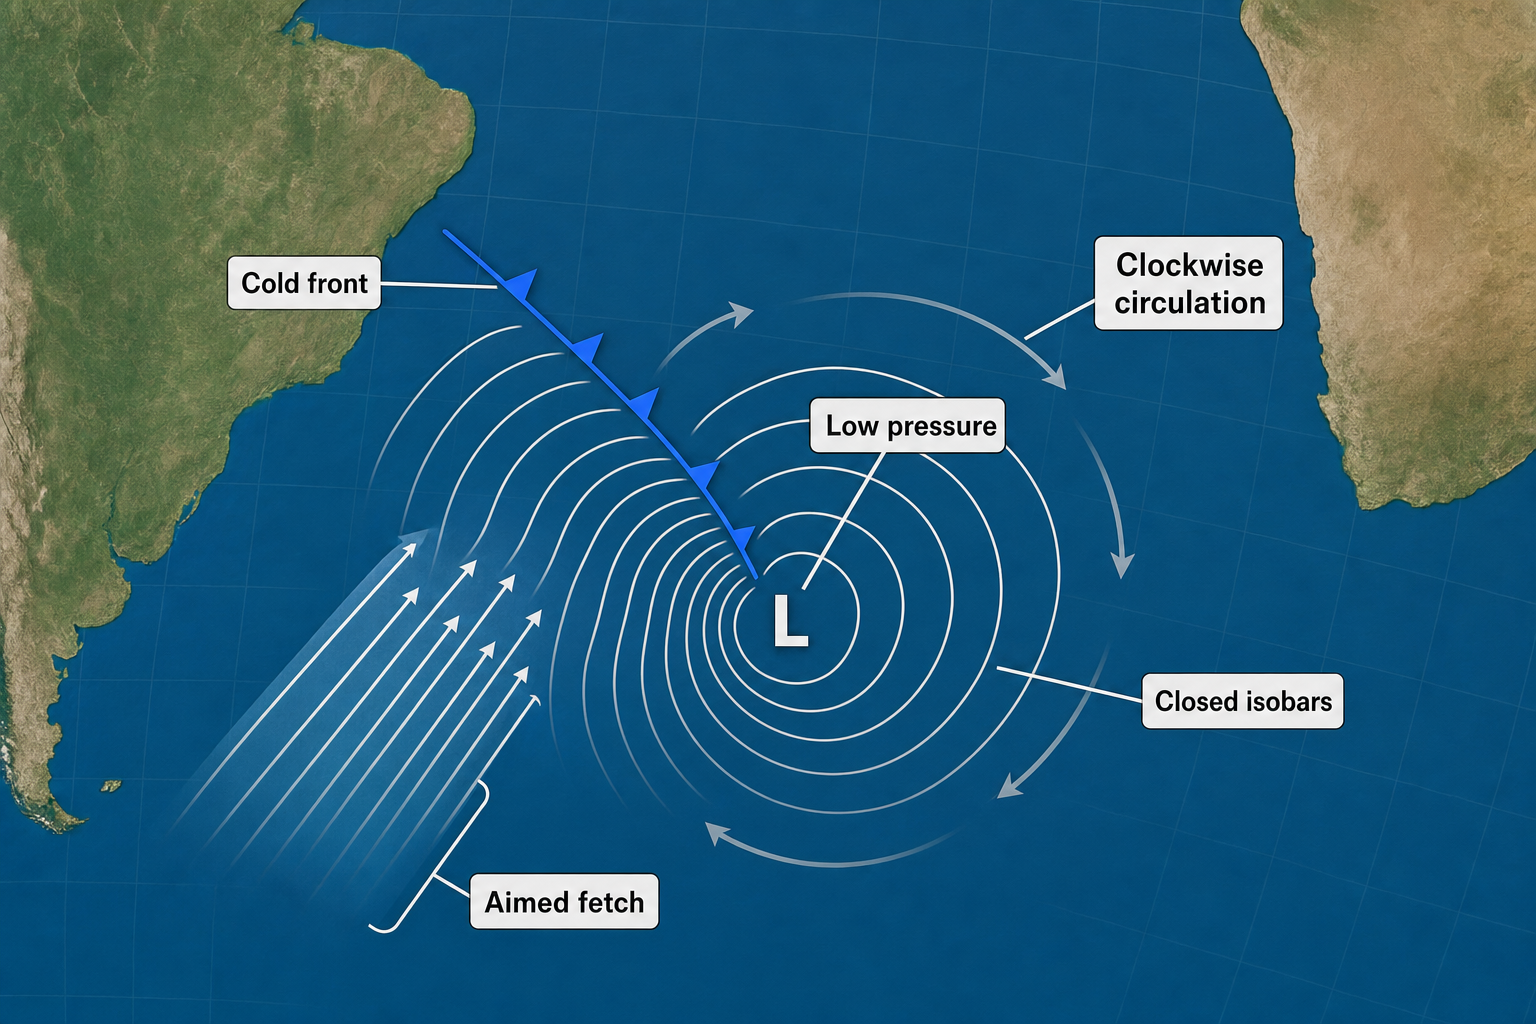
For Brazil, a classic setup is a low near Uruguay or offshore of southern Brazil with strong high pressure behind the front over Argentina. The pressure gradient creates south or southwest winds over a long stretch of ocean, producing south to southeast swell for southern and southeastern Brazil.
Southern Ocean Lows
Deep lows moving through the Roaring Forties and Furious Fifties are major swell sources for Namibia and South Africa. These storms often have central pressures in the 940s to 970s hPa range. The strongest fetch is usually on the northern and western sides of the storm, where west to southwest winds push swell toward Africa.
These systems can also send long-period energy northward when part of the fetch points toward the equator. When that happens, faint but highly organized swell can reach the Caribbean, Puerto Rico, Florida, the Outer Banks, and sometimes the U.S. Northeast. Monitoring barometric pressure trends at home with a marine barometer can give you an early sense of incoming weather patterns.
Cutoff Lows and Subtropical Lows
Cutoff lows occur when an upper-level trough detaches from the main westerly flow. They can sit over the western or central South Atlantic for several days. When paired with high pressure to the south, these lows can produce strong east or southeast winds aimed at Brazil.
Subtropical lows are hybrid systems with both tropical and extratropical characteristics. They are usually smaller than classic winter storms, but they can be excellent swell producers when they stall in the right location. Their swell typically runs 8 to 14 seconds, with direction varying from east to southeast for Brazil and south to southeast for northbound pulses.
The South Atlantic High and Trade-Wind Swell
The South Atlantic High is a semi-permanent high-pressure system centered over the subtropical ocean. It isn’t a storm, but it creates persistent trade winds. On its equatorward side, easterly and southeasterly winds blow across long distances, producing regular 6 to 10 second swell for northeastern Brazil and parts of the tropical Atlantic. The waves are generally less powerful than groundswell, but their consistency makes them important during quieter storm periods.
Rare Tropical and Subtropical Cyclones
True tropical cyclones are rare in the South Atlantic because sea surface temperatures are often marginal, vertical wind shear is common, and the Intertropical Convergence Zone is usually too close to the equator to support strong rotation. When warm water above about 26°C combines with low shear near Brazil, compact tropical or subtropical systems can form. These storms generate punchy, medium-period swell near Brazil, though their compact fetch tends to produce shorter periods than large winter lows.
Seasonal Patterns in South Atlantic Swell
| Season | Main Swell Sources | Typical Swell | Most Affected Regions | Wave Quality Pattern |
|---|---|---|---|---|
| December to February | Trade winds, subtropical lows, rare tropical systems | 6 to 12 seconds; occasional 13 second pulses | Northeast Brazil, eastern Brazil, tropical Atlantic | More wind-dependent; best when local winds relax or turn offshore |
| March to May | Early cold fronts and cutoff lows | 9 to 16 seconds from S, SE, or ESE | Brazil, Namibia, South Africa | Often improving as frontal systems strengthen |
| June to August | Deep Southern Ocean lows and strong fronts | 12 to 22 seconds; strongest events 18 seconds or more | Brazil, Namibia, South Africa, distant northbound coasts | Best season for powerful groundswell and long-lined surf |
| September to November | Active fronts and migrating lows | 10 to 18 seconds from S, SW, SE, or ESE | Brazil, western Africa, South Africa, occasional U.S. East Coast | Good balance of storm activity and lighter local winds in some regions |
How South Atlantic Swell Affects Different Surf Regions
The ranges below describe typical surf heights at exposed breaks, not deep-water wave heights. Local bathymetry, island shadowing, and coastline angle can make actual surf much bigger or smaller than the offshore swell suggests. A world atlas is genuinely useful for visualizing the geographic relationships between storm tracks and receiving coastlines.
| Region | Swell Direction | Typical Surf Height | Typical Period | Best Season | Wave Quality |
|---|---|---|---|---|---|
| Southern and southeastern Brazil | S, SSE, SE, ESE | 3 to 8 ft; larger events 10 ft+ | 9 to 16 seconds | April to September | Often best after fronts, when west or northwest winds clean up south swell |
| Northeastern Brazil | E, ESE, SE; rare S swell wraps | 2 to 6 ft from trades; rare groundswell smaller but cleaner | 7 to 11 seconds from trades; 13 to 17 seconds from distant storms | June to October for trades; occasional winter groundswell | Consistent but often wind-affected; better at protected reefs and points |
| Northern Africa Atlantic coast | SSW to SW | 1 to 4 ft from South Atlantic sources | 14 to 20 seconds | May to September | Usually secondary to North Atlantic swell; low-angle lines favor exposed south-facing corners |
| Namibia | SSW, SW, WSW | 4 to 12 ft; major events 15 ft+ | 12 to 20 seconds | April to September | Excellent when long-period SW swell meets offshore easterly flow |
| South Africa | SW, WSW, SSW | 4 to 15 ft on exposed west and south coasts | 11 to 20 seconds | May to September | Powerful and consistent; west-facing coasts see the most direct South Atlantic energy |
| Caribbean Islands | SSE, SE, ESE | 1 to 4 ft at exposed windows | 12 to 18 seconds | May to October | Rare but clean; island shadowing is the main limiter |
| Puerto Rico | SSE to SE for south and east exposures | 1 to 3 ft; occasional stronger pulses 4 ft+ | 13 to 18 seconds | Late spring to early fall | Inconsistent and selective; north coast relies much more on North Atlantic swell |
| Florida | ESE, SE, SSE | 1 to 3 ft; rare events 4 to 5 ft | 13 to 18 seconds | May to September | Small but well-organized; Bahamas shadowing reduces many pulses |
| North Carolina | SE to SSE | 2 to 5 ft; strong events 6 ft+ | 13 to 19 seconds | May to October | Outer Banks exposure makes this one of the better U.S. receivers |
| Delaware | SE to SSE | 1 to 4 ft | 13 to 18 seconds | May to October | Can be clean but heavily shaped by the Delmarva coastline and shelf |
| New Jersey | ESE to SSE | 2 to 5 ft | 13 to 18 seconds | May to October | Long-period lines can be excellent when local winds are offshore |
| New York | ESE to SSE | 1 to 4 ft; exposed beaches bigger | 13 to 18 seconds | May to October | Selective due to the New York Bight, but quality can be high |
| Massachusetts | SE to SSE | 1 to 4 ft; Cape Cod more exposed | 14 to 19 seconds | June to October | Long travel distance makes swells lully but organized |
| Maine | SE to SSE | 1 to 3 ft; rare larger pulses | 14 to 19 seconds | June to October | Highly filtered by coastline shape; best at open southeast windows |
South Atlantic Swell in Brazil
Brazil is the most direct western receiver of South Atlantic storm energy. Southern Brazil gets the strongest and most consistent south swell because it sits closest to the cold-front corridor. Santa Catarina, Paraná, São Paulo, and Rio de Janeiro all benefit from lows that move off Argentina and Uruguay.
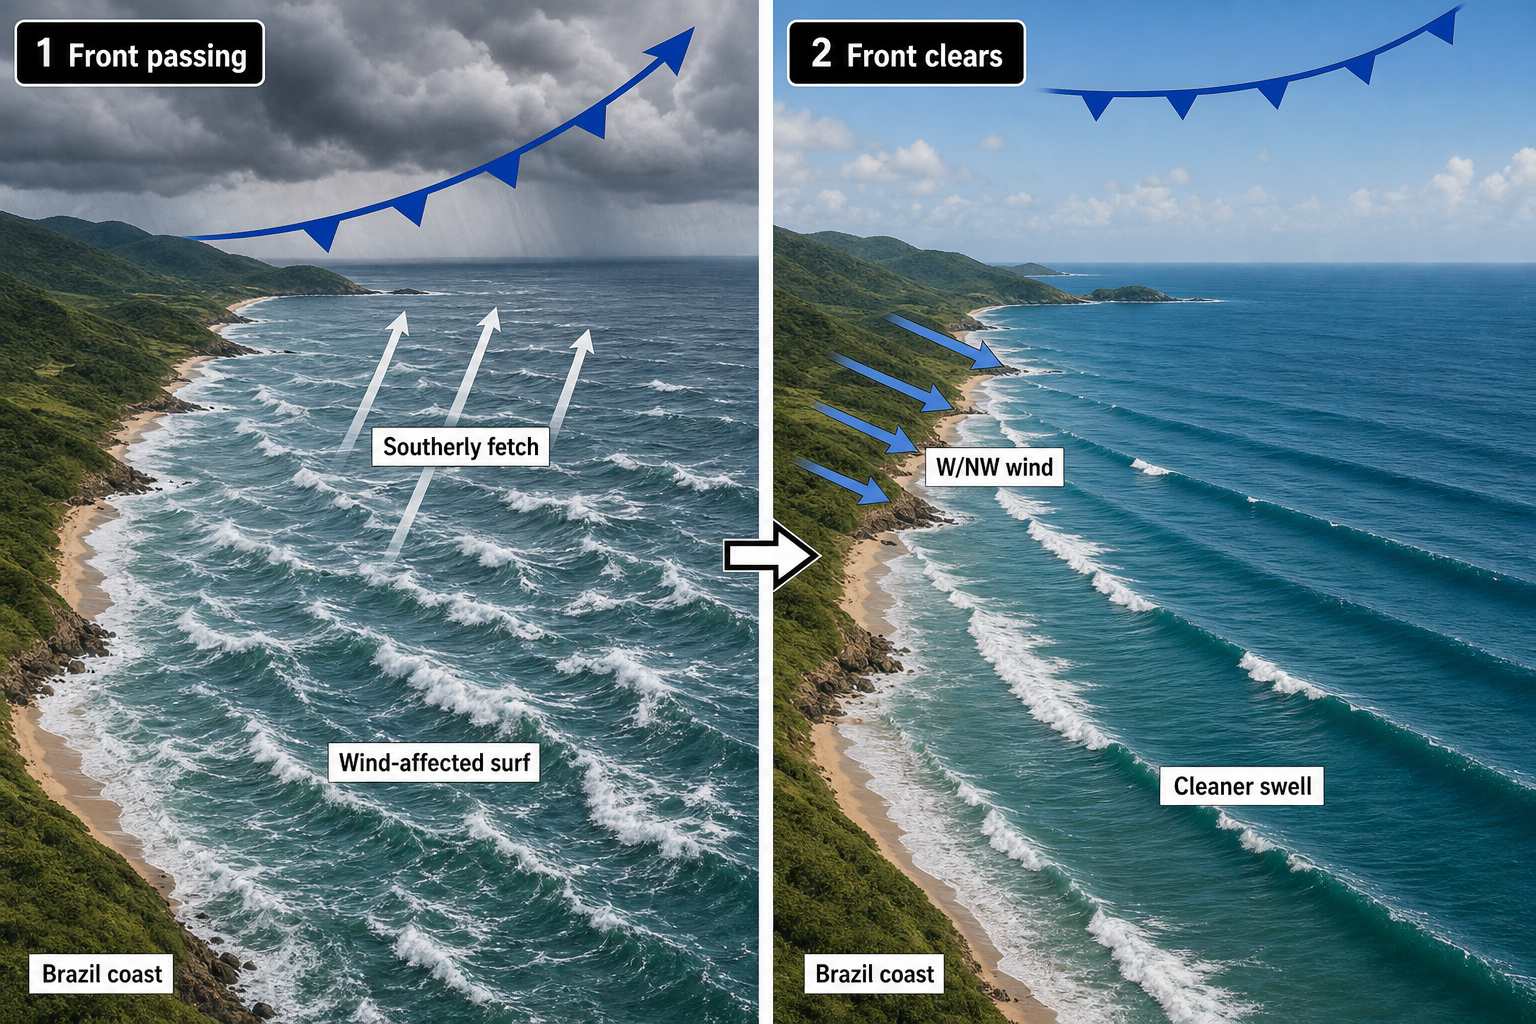
The classic Brazilian pattern is a cold front passing north, followed by a strong southerly fetch behind it. At first, surf may be stormy and wind-affected. As the front clears and the wind turns west or northwest, that same swell often becomes cleaner and more organized. Logging these patterns in a dedicated surf journal over time can help you recognize recurring setups faster.
In summer, the dominant energy shifts toward shorter-period east and northeast trade swell. Subtropical lows can still produce quality surf, especially when they stall offshore and aim southeast or east-southeast swell into the coast.
South Atlantic Swell in Namibia and South Africa
Namibia and South Africa are open to powerful Southern Ocean energy. The strongest storms pass south of the continent, but their fetches often extend far enough north to send long-period SW groundswell into the South Atlantic side of Africa.
Namibia is especially sensitive to SW and SSW swell. Long-period energy can wrap into desert points and sand-bottom setups with remarkable organization. The best swells usually come from large lows southwest or south-southwest of the country, with periods in the 15 to 20 second range. Studying a detailed coastal navigation chart can help you understand exactly how swell windows and bathymetry interact along this stretch of coastline.
South Africa’s west coast and Cape region receive direct South Atlantic groundswell from the southwest and west-southwest. The south coast receives a mix of wrapped South Atlantic energy and Southern Ocean swell. Farther east, Indian Ocean systems become more important, but strong SW groundswell can still wrap around the Cape and influence exposed breaks.
South Atlantic Swell Reaching the Caribbean and Puerto Rico
By the time South Atlantic swell reaches the Caribbean, it has traveled a long distance and lost much of its size. The reward is organization: long-period lines can arrive with little local storminess. The challenge is exposure. Many islands block south and southeast swell, so only certain reef passes, points, and open coastlines receive it well.
Puerto Rico is not a primary South Atlantic swell destination. The north coast is mainly a North Atlantic swell zone. The south and east coasts can receive rare SSE to SE pulses, usually during the Northern Hemisphere summer or early fall, when Southern Hemisphere storm activity is stronger and the North Atlantic is quieter.
South Atlantic Swell on the U.S. East Coast
South Atlantic groundswell is not a dominant source for the U.S. East Coast. Hurricanes, nor’easters, and local wind events produce most East Coast surf. Still, strong Southern Hemisphere storms can send small but clean southeast swell into the western North Atlantic. Staying on top of incoming weather systems is easier with a reliable NOAA weather alert radio at home or a handheld VHF marine radio for coastal use.
North Carolina is one of the better U.S. receivers because the Outer Banks have open exposure to SE and SSE energy. New Jersey can also do well when the direction is not too southerly. Florida is more limited because the Bahamas block many long-period southeast lines, especially in the southern part of the state.
Farther north, Massachusetts and Maine need a more easterly component or a very long-period swell to overcome coastline filtering. Cape Cod and other exposed southeast-facing areas can show the swell while more sheltered zones remain nearly flat.
What South Atlantic Swell Storms Look Like on Weather Maps
Reading weather maps becomes significantly easier with practice. A guide to reading nautical charts can help you get comfortable interpreting pressure systems and isobar patterns. For surfers who prefer working with physical maps in the field, keeping them protected in a waterproof map case is a practical habit.
A Brazil South Swell Weather Map
Look for a low-pressure center east of Argentina or Uruguay, a cold front extending into the western South Atlantic, and high pressure building behind it. The strongest signal is a broad area of south or southwest winds aimed toward Brazil. Isobars packed tightly between a 980 to 1000 hPa low and a 1025 to 1040 hPa high usually indicate a pressure gradient strong enough to generate surf.
A Namibia and South Africa Groundswell Map
For Namibia and South Africa, look farther south. A deep low below 40°S with a long belt of west or southwest gale winds is the classic sign. The best maps show a long, uninterrupted fetch moving roughly toward the African coast. A storm that travels in the same direction as the swell it generates can create a captured fetch effect, which boosts both period and size. Tracking wind conditions with a handheld anemometer can help you ground-truth what the models are showing.
A Northbound South Atlantic Swell Map
For the Caribbean and U.S. East Coast, the storm must aim energy northward. Look for a central or western South Atlantic low with strong southerly winds on its western side. The fetch needs to point through an open swell window between landmasses. If the storm is too far east, Africa blocks the path. If it is too far west, Brazil and the Caribbean islands may shadow the swell.
A Trade-Wind Swell Map
Trade-wind swell appears differently on a map. Instead of a tight storm center, you’ll see a broad South Atlantic High with persistent easterly or southeasterly winds on its northern side. The isobars are not as tightly packed as in a winter storm, but the wind covers a large area for many days. This favors consistency over power. Monitoring local pressure trends with a wireless weather station can help you track high-pressure systems as they build and shift.
How to Forecast South Atlantic Swell
Step 1: Identify the Aimed Fetch
Start by finding the strongest wind area, not just the lowest pressure. A deep low with winds blowing away from your coastline may produce little surf. A weaker low with a long, well-aimed fetch can be far more useful.
For each destination, ask: are the storm winds blowing toward the coastline’s swell window? Brazil needs south through east-southeast energy depending on the region. Namibia and South Africa need SW to WSW energy. The Caribbean and U.S. East Coast need southeast or south-southeast energy that can avoid major island shadows.
Step 2: Estimate Swell Period and Size
Use wind strength and fetch length to estimate period. A 25 knot trade-wind fetch may produce 7 to 9 second swell. A 35 to 45 knot regional gale may produce 10 to 15 second swell. A large 50 knot storm with a long fetch can generate 16 to 22 second groundswell.
Wave models such as WaveWatch III, ECMWF wave output, and global swell charts are useful, but they should always be checked against the actual wind field. Models can overstate long-range swell when land shadowing or directional spreading isn’t handled well.
Step 3: Calculate Arrival Time
Long-period forerunners arrive first. If a 19 second swell is traveling 8,000 kilometers, it may arrive in about six days. The bulk of the 15 to 17 second energy arrives later, because shorter-period components travel more slowly. This is why distant South Atlantic swells often begin with inconsistent, tiny lines before the main pulse fills in. Those first visible sets are not always the peak of the swell.
Step 4: Adjust for Coastline Angle and Bathymetry
A strong deep-water swell doesn’t guarantee good surf. Long-period waves refract strongly over continental shelves, canyons, and reefs. Some spots can amplify a 2 foot deep-water swell into fun surf, while others lose most of the energy because the swell direction is too oblique.
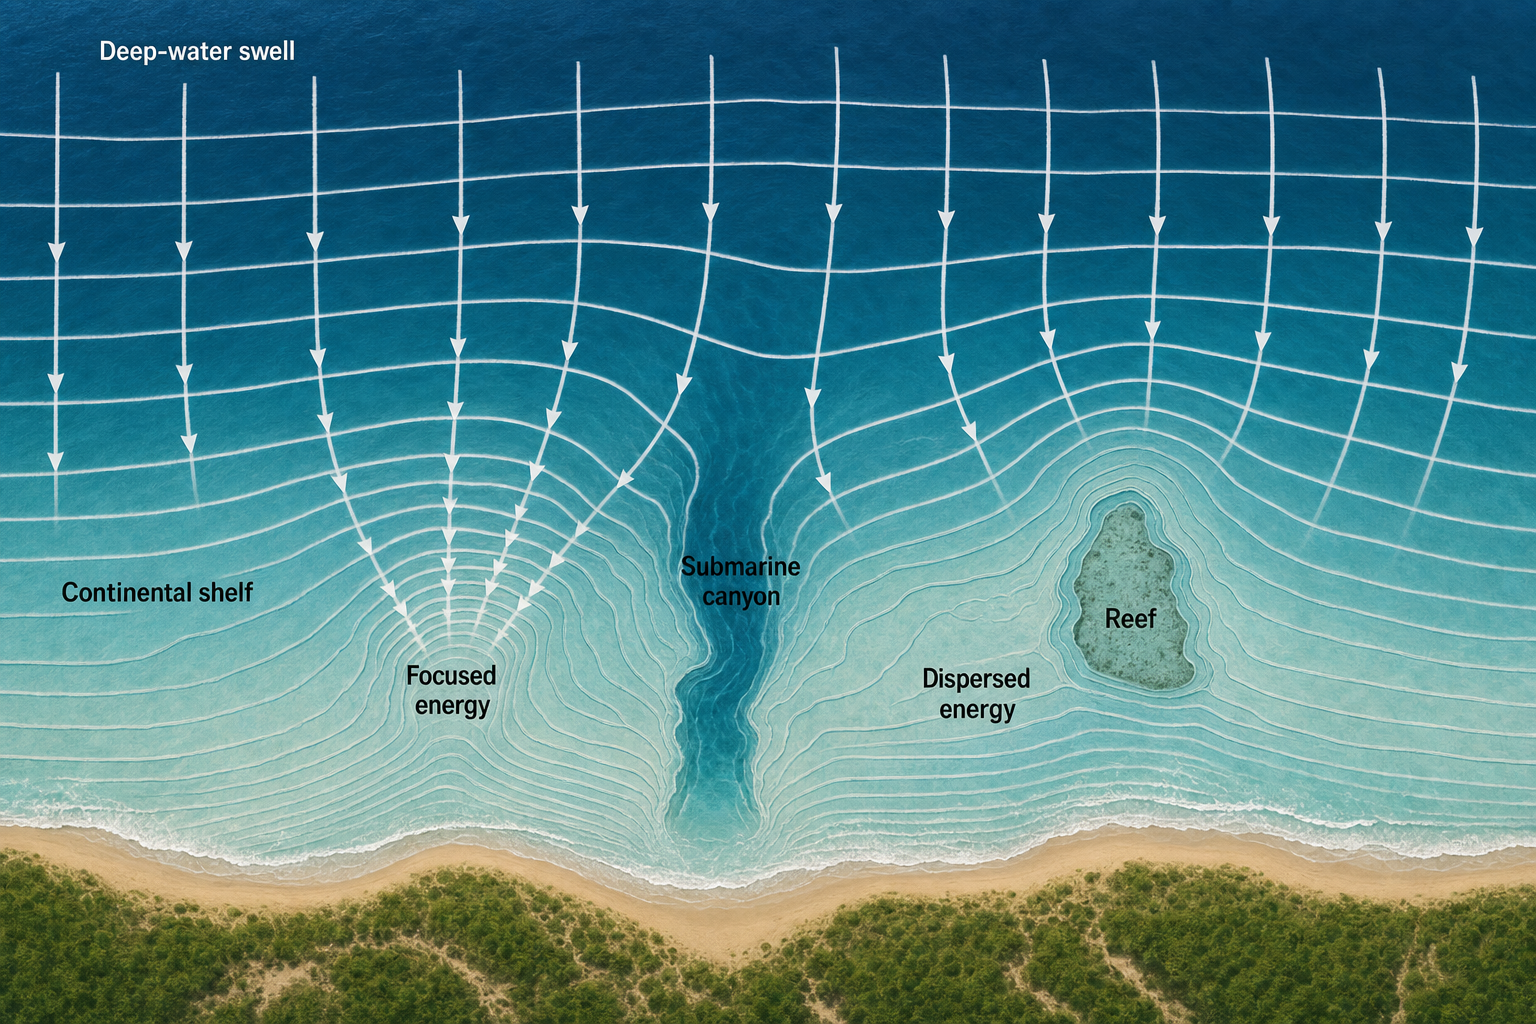
For long-range South Atlantic swell on the U.S. East Coast, island shadowing is often the deciding factor. For Namibia and South Africa, period and direction determine which points and reefs receive the best shape. For Brazil, the difference between S, SSE, and SE can completely change which beaches are exposed. A detailed regional map can help you visualize coastline angles and geographic exposure when working through these details.
Step 5: Verify with Buoys and Satellite Data
Once the swell leaves the storm, use satellite altimeter passes and offshore buoys to confirm it exists. For distant swells, look for a small rise in long-period energy before expecting surf at the beach. If the period appears but the direction is wrong, the swell may pass offshore or miss the best breaks entirely.
The South Atlantic rewards careful, patient forecasting. A cold front can light up Brazil within days. A Southern Ocean low can send powerful SW groundswell into Namibia and South Africa. A well-aimed fetch can even deliver small, clean lines to the Caribbean or the U.S. East Coast a week later. The more closely you read the wind field, pressure pattern, and swell window, the easier it becomes to separate real surf potential from model noise.