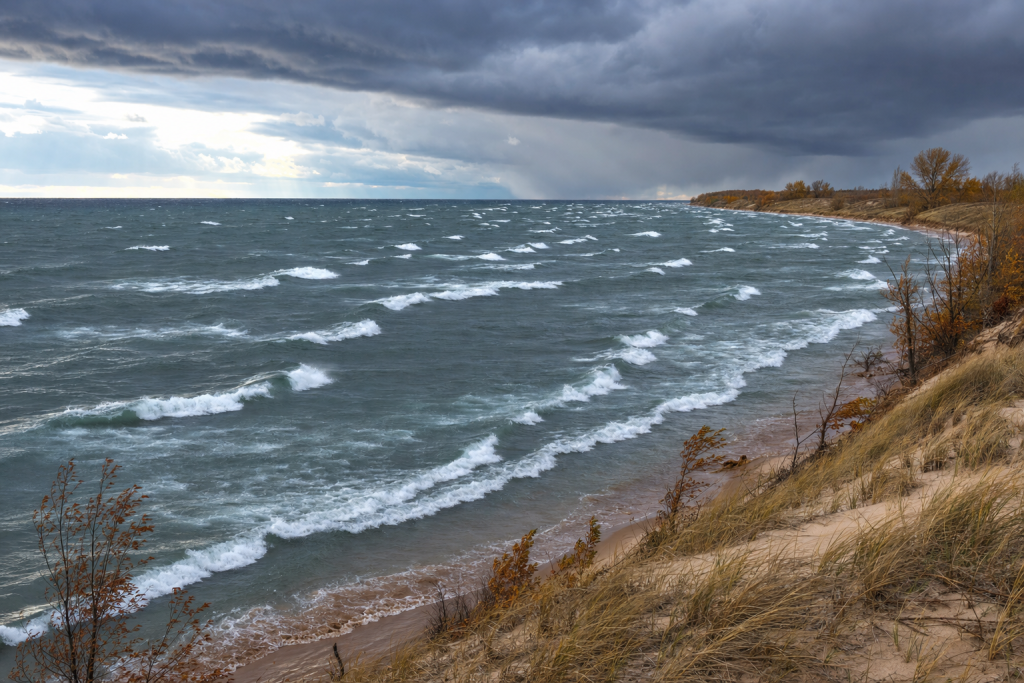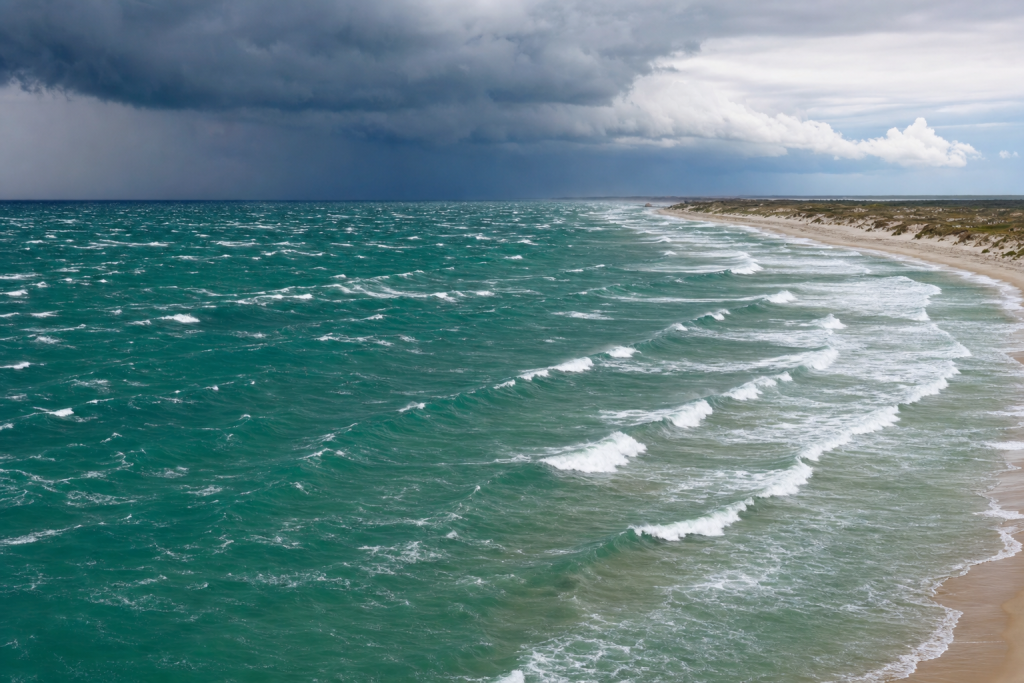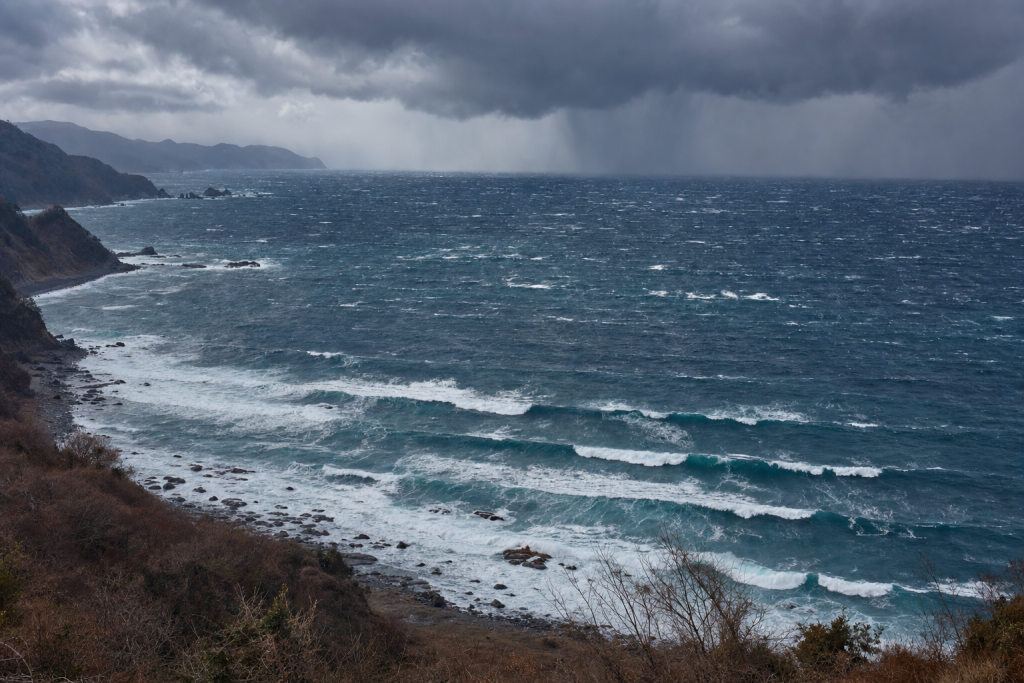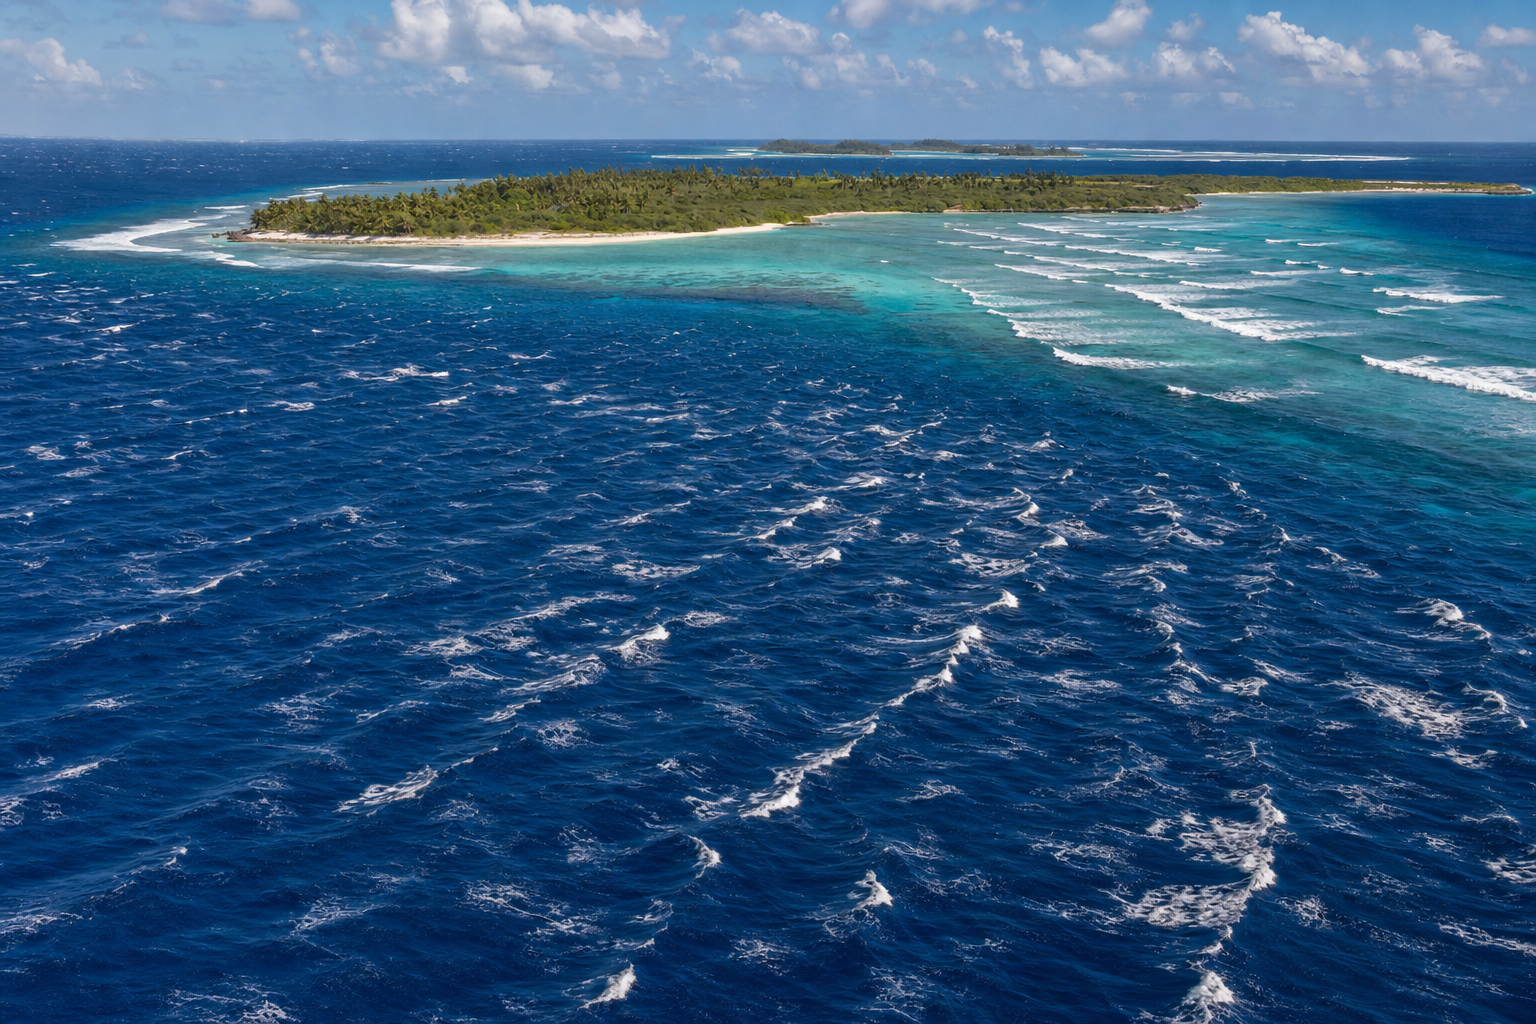
Caribbean surf is created by a surprisingly varied mix of weather systems. A knee-high trade-wind wave in Barbados, a long-period north swell in Puerto Rico, and a hurricane pulse wrapping into a sheltered reef can all happen in the same basin — but they come from very different storms. Understanding how waves are generated in the Caribbean Sea means learning how wind, pressure, fetch, island shadowing, and seasonal storm tracks work together. If you want to go deeper on the science behind all of this, a surf forecasting guide can be a solid place to start. Once those pieces make sense, Caribbean surf forecasts become much easier to read.
How Caribbean Sea Waves Are Generated
Waves form when wind transfers energy into the ocean surface. The size and quality of those waves depend mainly on three things: wind speed, duration, and fetch. Fetch is the uninterrupted distance of water over which wind blows in the same direction. In the Caribbean, geography is just as important as the wind itself. The sea is enclosed by Central America to the west, South America to the south, and the Greater and Lesser Antilles to the north and east — and that creates many blocked swell windows. Some coasts receive open Atlantic energy, while others only get short-period waves generated inside the Caribbean basin. For a broader look at how oceans behave, an introductory oceanography textbook covers wave formation and ocean dynamics in useful detail.
For surf forecasting purposes, Caribbean waves fall into two broad categories:
- Local and regional wind swell: Shorter-period waves created by trade winds, cold-front surges, or nearby tropical systems.
- Groundswell: Longer-period swell created by stronger storms with larger fetches, often originating north of the islands or from hurricanes.
Wave period — the time between wave crests — often tells you more about quality than wave height alone. A 4-foot swell at 14 seconds can produce powerful, organized surf on reefs. A 4-foot swell at 6 seconds is usually weaker and more wind-affected.
Why Caribbean Swell Windows Vary So Much by Island
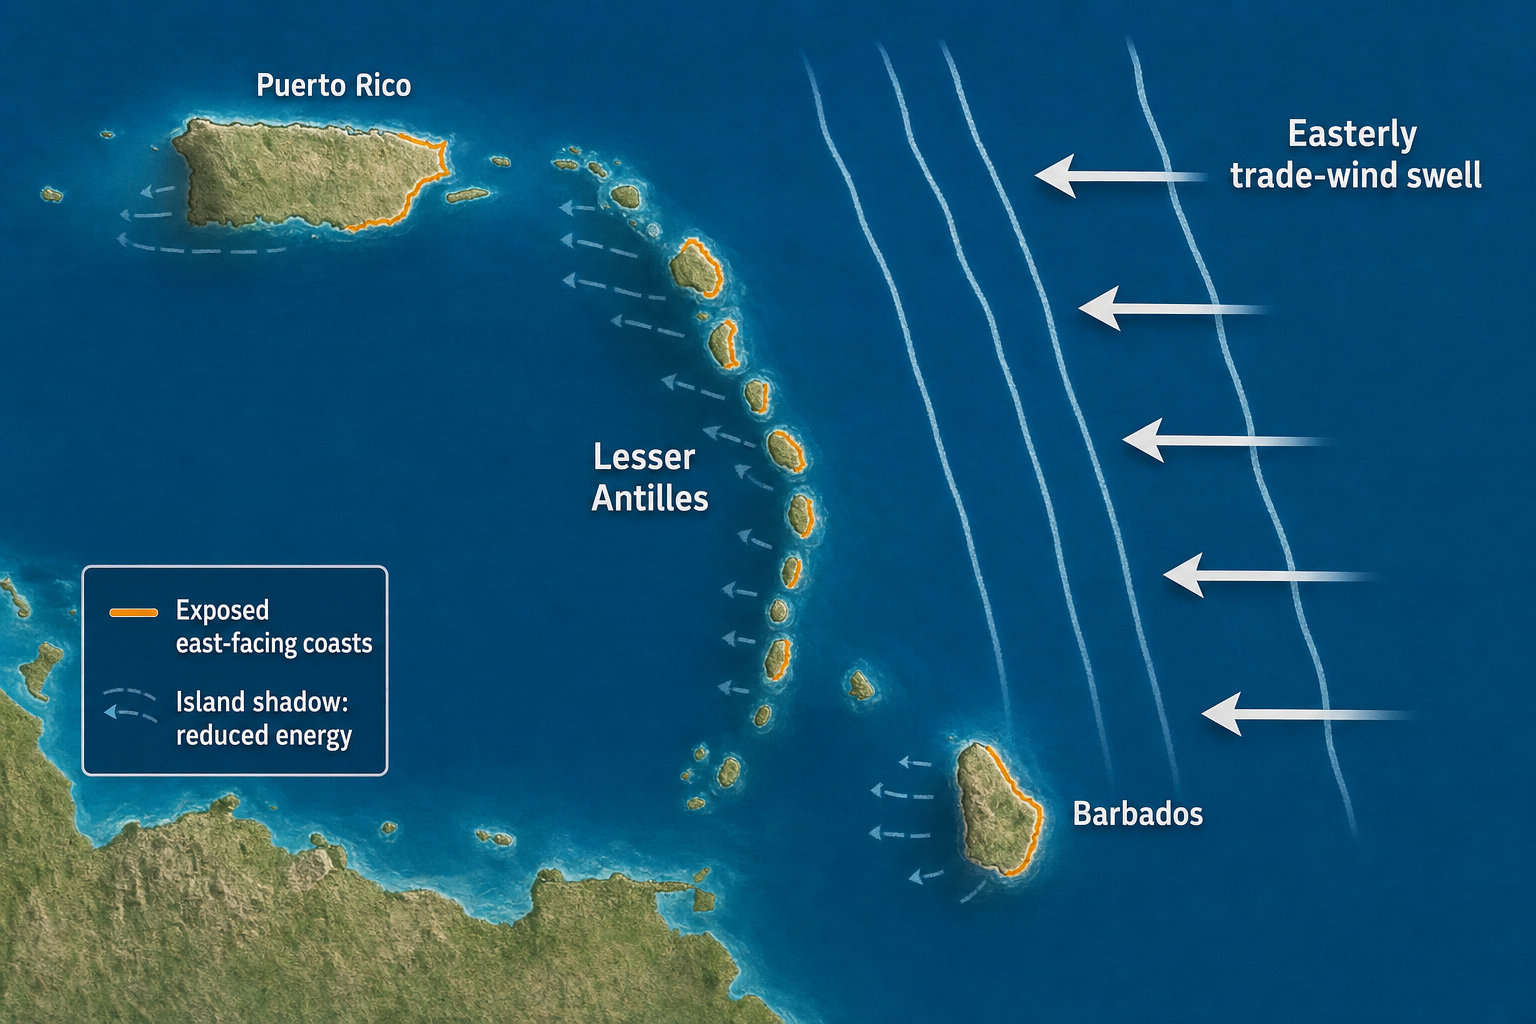
The Caribbean is not one uniform surf zone. A storm that creates excellent waves for one island may go almost unnoticed on another because of island shadowing.
North-Facing Caribbean Coasts
North-facing coasts — such as those of northern Puerto Rico, the Dominican Republic, and northern Jamaica — are best exposed to north and northeast swells. Many of their better surf events are generated outside the Caribbean Sea entirely, driven by North Atlantic low-pressure systems, winter cold fronts, or tropical cyclones passing north of the islands. These swells often have periods of 10 to 16 seconds and reach the region through open Atlantic exposure or gaps between islands. The Mona Passage, Anegada Passage, and Windward Passage are important swell corridors.
East-Facing Caribbean Coasts
East-facing coasts receive the most consistent trade-wind swell. Islands throughout the Lesser Antilles, along with Barbados and eastern Puerto Rico, regularly see easterly wave energy generated by northeast to east trade winds blowing across the tropical Atlantic. Typical periods are shorter — usually 5 to 9 seconds — though tropical storms can push longer-period energy from the east or southeast.
South-Facing and West-Facing Caribbean Coasts
South-facing breaks are more selective. They usually need tropical cyclones, monsoon-type lows, or unusual wind patterns inside the basin to fire. Spots in Puerto Rico, Hispaniola, Jamaica, and the Dutch Caribbean can receive swell from storms tracking through the central or southern Caribbean. West-facing breaks are even more dependent on unusual setups — wraparound north swell, western Caribbean lows, or strong frontal winds behind cold fronts.
The Main Storm Types That Generate Caribbean Sea Waves
Several weather patterns create surfable waves in the Caribbean. Each has a different signature on weather maps and produces different swell direction, period, and quality.
Trade-Wind Swell
Trade winds are the Caribbean’s most consistent wave maker. They blow mainly from the east or northeast due to the pressure gradient between subtropical high pressure over the Atlantic and lower pressure near northern South America. The strongest trade-wind pattern typically appears when a 1024 to 1032 millibar high sits north or northeast of the Caribbean, while lower pressure near Colombia or Panama holds around 1006 to 1012 millibars. The tighter the gradient, the stronger the easterly winds.
On a weather map, this setup shows broad high pressure over the western or central Atlantic with tightly packed isobars stretching across the Caribbean. Wind arrows point east to west across a long fetch. The strongest trades often accelerate off Colombia and Venezuela, producing steep, choppy seas in the south-central Caribbean. Trade-wind swell is usually short-period energy — fun and consistent, but often rough at exposed east-facing breaks unless local winds are light or offshore.
North Atlantic Lows and Caribbean North Swell
Many of the best winter swells in the northern Caribbean are generated by extratropical low-pressure systems in the western or central North Atlantic. These are not tropical cyclones — they are cold-core systems with fronts, strong pressure gradients, and large wind fields. On a weather map, a good north-swell-producing low often has a central pressure of around 980 to 1005 millibars. It may sit near Bermuda, east of the United States, or farther into the central Atlantic. The key feature is a long fetch of northerly or northwesterly winds aimed toward the Caribbean.
These systems often produce the cleanest and most powerful Caribbean groundswells, with periods commonly running 11 to 16 seconds and swell directions of north to northeast. Because the storm may be far away, local weather in the islands can be sunny and calm when the swell arrives — a welcome combination. Understanding how to interpret the isobars and frontal boundaries that drive these systems is a valuable skill. A weather terminology reference can help you decode the language used in forecasts and synoptic charts.
Cold Fronts and Northerly Wind Surges
Cold fronts are important wave generators from late autumn through spring. A cold front pushing through the Gulf of Mexico, the Bahamas, Cuba, or the northwest Caribbean can produce strong north to northeast winds in its wake. On a weather map, look for a blue frontal boundary with triangles pointing in the direction of movement. Behind the front, high pressure often builds over the southern United States or Gulf of Mexico. When isobars pack tightly between the high and lower pressure to the east or south, a northerly surge spreads into the Caribbean.
Cold fronts can generate surf in two ways. First, the front itself may create regional wind swell in the western or northern Caribbean. Second, the larger weather pattern may include a North Atlantic low that sends longer-period groundswell. Frontal swells are often shorter-period than open Atlantic groundswells and may arrive with strong local winds at first, then improve as the pressure gradient relaxes.
Tropical Waves and Tropical Depressions
Tropical waves are common during the Atlantic hurricane season. They move westward from the tropical Atlantic into the Caribbean as elongated troughs of low pressure. Many never develop into named storms, but they can still enhance trade winds and create surf. On a weather map, a tropical wave often appears as an inverted trough or kink in the trade-wind flow, with satellite images showing clusters of thunderstorms east of the Lesser Antilles or over the central Caribbean.
If a wave develops a closed circulation, it may become a tropical depression. Wind speeds increase, the fetch becomes better organized, and the system can generate more defined swell with periods typically ranging from 8 to 12 seconds depending on strength and distance.
Tropical Storms and Hurricanes
Tropical storms and hurricanes produce some of the most memorable Caribbean swells, capable of generating long-period energy even when the storm is not especially close to a surf zone. A tropical storm has sustained winds of at least 39 mph. A hurricane has sustained winds of at least 74 mph. Stronger systems have lower central pressure and a more intense pressure gradient. Significant swell producers often show pressures below 990 millibars, while major hurricanes can go much lower.
On a weather map, a tropical cyclone appears as a closed low with circular or spiral isobars. The strongest wave generation typically occurs in the right-front quadrant of the storm’s motion in the Northern Hemisphere, where forward speed adds to the rotating wind field. Hurricane swell direction depends on storm position and track — a storm east of the Lesser Antilles can send east or southeast swell, while one north of Puerto Rico sends north or northeast energy.
Keeping an eye on developing storms is easier with the right tools at home. A NOAA weather alert radio can give you real-time updates on developing tropical systems, which matters both for surf planning and safety. If you spend time on the water, a handheld VHF marine radio with weather alerts is worth having for the same reason.
Monsoon Gyres and Western Caribbean Lows
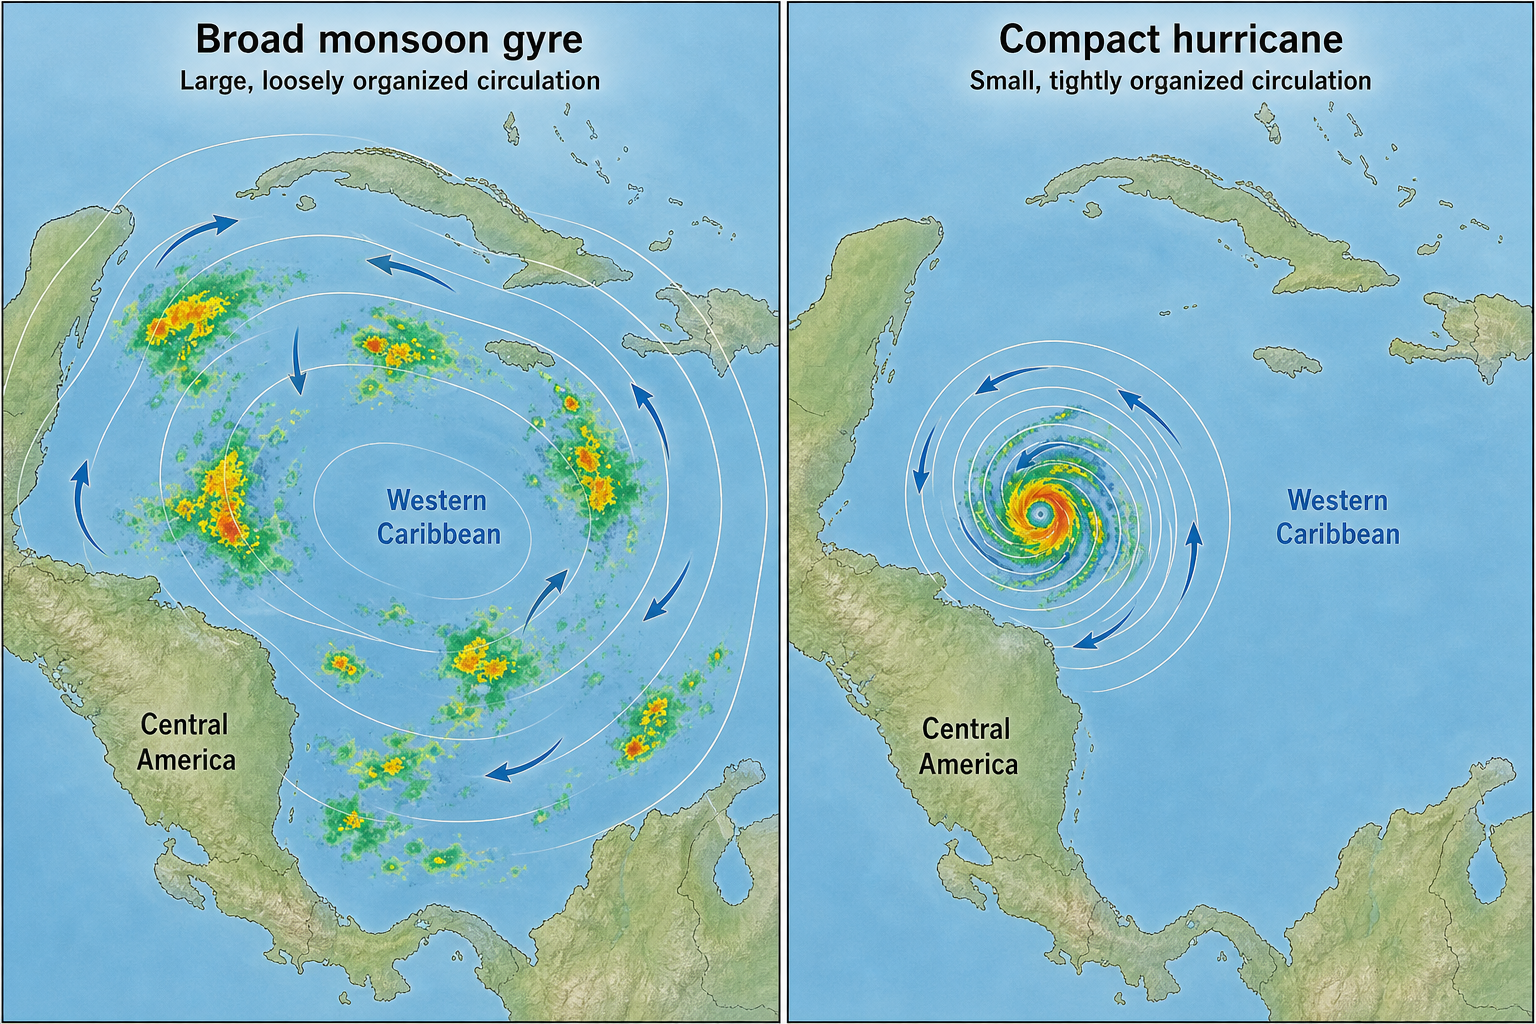
Broad low-pressure areas sometimes develop near Central America or the western Caribbean, often connected to the Central American monsoon gyre during late spring or autumn. Unlike a compact hurricane, a gyre is large and loosely organized. On a weather map, it shows broad cyclonic rotation, widespread lower pressure, and large areas of converging wind — a big enough wind field to generate surf even without a strong storm center. These systems can produce unusual swell directions, with periods typically in the 7 to 11 second range.
Typical Caribbean Sea Swell by Season
The Caribbean has surf year-round, but the dominant swell sources shift with the seasons. The numbers below are broad ranges — actual surf size depends on exposure, reef shape, and island shadowing.
| Season | Main Wave Generators | Typical Swell Direction | Typical Height | Typical Period | Wave Quality |
|---|---|---|---|---|---|
| Winter: December–March | North Atlantic lows and cold fronts | North to northeast; sometimes northwest in the western Caribbean | 4 to 12 feet on exposed coasts; larger during major events | 9 to 16 seconds | Often the best season for organized groundswell on north-facing reefs and points |
| Spring: April–May | Late fronts and trade-wind bursts | Northeast to east | 2 to 6 feet on exposed coasts | 6 to 12 seconds | Mixed quality; cleaner when local winds ease |
| Summer: June–August | Trade winds and early tropical systems | East to southeast; occasional north or northeast from storms | 2 to 6 feet from trades; larger from tropical cyclones | 5 to 9 seconds for trades; 10 to 16 seconds for cyclones | Consistent but often wind-affected, with high-quality pulses from distant tropical systems |
| Autumn: September–November | Hurricanes, tropical storms, and early fronts | Variable: north, northeast, east, or south | 3 to 12 feet on exposed coasts; larger during strong cyclones | 8 to 17 seconds | Can be excellent as swell energy increases and local winds become more variable |
Typical Caribbean Swell from Each Storm Type
Forecasting improves when you can connect a storm type to the swell it typically produces. The table below summarizes the most common patterns.
| Storm or Pattern | Weather Map Signature | Swell Direction | Period | Quality |
|---|---|---|---|---|
| Trade-wind surge | Strong Atlantic high and lower pressure near Colombia | East to northeast | 5 to 9 seconds | Reliable but often bumpy at exposed breaks |
| North Atlantic low | Deep low with fronts north of the Caribbean | North to northeast | 11 to 16 seconds | Usually powerful and organized if local wind cooperates |
| Cold front | Front crossing Cuba, Bahamas, or the northwest Caribbean | North, northeast, or northwest | 7 to 13 seconds | Can be rough at first, then cleaner after the front passes |
| Tropical wave | Inverted trough with squalls and enhanced trades | East to southeast | 6 to 10 seconds | Usually peaky and inconsistent, but useful for exposed east coasts |
| Tropical storm | Closed low with organized convection | Depends on storm track | 8 to 14 seconds | Can be very good if the storm stays distant and local winds are favorable |
| Hurricane | Compact low with circular isobars and intense winds | Highly track-dependent | 11 to 18 seconds or more | Often the strongest surf source, especially for selective swell windows |
| Monsoon gyre or western Caribbean low | Broad low pressure with large cyclonic wind field | South, southeast, east, or west depending on position | 7 to 11 seconds | Variable, but capable of unusual and useful swell directions |
Weather, Temperature, and Pressure Factors Behind Caribbean Surf
Sea Surface Temperature and Tropical Development
The Caribbean is warm year-round, with sea surface temperatures commonly ranging from 26 to 30°C (79 to 86°F). Tropical cyclones generally need water at or above about 26.5°C, along with moist air and weak vertical wind shear to develop and intensify. Warm water does not automatically create waves — the waves still come from wind blowing over the surface — but warm seas support the storms that produce the strongest Caribbean swells. Monitoring sea surface temperatures is one useful piece of early-season hurricane and swell forecasting.
Atmospheric Pressure Gradients
Pressure gradients are central to wave generation. Wind is stronger when pressure changes sharply over a short distance, which shows up on weather maps as tightly packed isobars. For trade-wind swell, the classic gradient is high pressure north of the Caribbean and lower pressure near South America. For winter north swell, the key gradient is usually around a low-pressure system in the North Atlantic. For cold fronts, the strongest gradient often sits behind the boundary as high pressure builds in from the north.
Keeping an eye on local pressure trends can also be useful. A marine barometer lets you track changes in atmospheric pressure over time, which can give you an early read on whether conditions are building or fading. A wireless weather station with barometric pressure display does a similar job and is easy to set up at home or at a rental.
Wind Direction and Local Wave Quality
A swell can be strong but still surf poorly if local winds are working against it. The Caribbean’s prevailing winds are east to northeast trades, which means east-facing breaks are often exposed to onshore or side-shore wind while some west-facing or northwest-facing breaks can clean up under the same pattern. Morning conditions tend to be better on many islands because land breezes can weaken the trades near shore. As the day heats up, sea breezes and stronger trades add texture. This daily wind cycle matters especially during trade-wind swell seasons.
Checking actual wind speed at the beach is more reliable than reading a forecast alone. A handheld anemometer makes it easy to get a real wind speed reading on the spot, which helps when deciding whether a session is worth paddling out.
Bathymetry, Reefs, and Wave Transformation
Deep-water swell height is only part of the forecast. Caribbean reefs, shelves, and channels can dramatically change surf size and shape. Many islands rise steeply from deep water, allowing long-period swell to arrive with much of its energy intact. Once swell reaches a shallow reef, it refracts, steepens, and breaks. A modest deep-water swell can become much larger at a focused reef pass, while a nearby beach in the shadow of a headland may stay flat. Longer-period swell also refracts earlier as it approaches shallow water, which can make some reefs line up beautifully while causing others to close out.
How to Read Caribbean Storms on a Weather Map
Look for Fetch Aimed at the Break
The best storm is not simply the strongest one — it must have wind blowing across open water toward the surf zone. If the wind is strong but aimed away from the island, the swell may miss completely. Draw an imaginary line from the fetch to the break. If that line crosses open water, the swell window is open. If it crosses islands or land, much of the energy will be blocked.
Having a good map of the region handy makes this kind of analysis much easier. A detailed world atlas gives you a clear picture of island positions, open water corridors, and coast orientations throughout the Caribbean. If you want something more specialized, a guide to reading nautical charts will help you understand depths, swell corridors, and coastal features at a much finer level of detail.
Use Isobars to Estimate Wind Strength
Close isobars mean stronger winds. Wide isobars mean lighter winds. In the Northern Hemisphere, wind circulates counterclockwise around low pressure and clockwise around high pressure, with some inward angle toward lows near the surface. For Caribbean forecasting, do not only look at the storm center — look at the side of the storm where winds are aimed toward your coast. That is the wave-generating fetch.
Identify the Storm Structure
Different storms leave different fingerprints on a weather map:
- Extratropical low: Comma-shaped cloud shield, frontal boundaries, and broad gale-force wind areas.
- Cold front: A sharp boundary with stronger north or northeast winds behind it.
- Tropical cyclone: Closed circular low with organized bands around a warm center.
- Tropical wave: A trough line with a wind shift and clusters of thunderstorms, but no mature closed center.
- Trade surge: Broad high pressure north of the region with persistent easterly flow across the basin.
For reference while working through charts and maps in the field, a printed coastal navigation training chart can help you get comfortable reading the spatial relationships between storm systems and coastlines. Protecting your maps and charts from salt spray and rain is worth doing — a waterproof map case keeps everything readable even in wet conditions.
How to Forecast Caribbean Sea Waves from Regional Storms
Step 1: Know the Break’s Swell Window
Before analyzing any storms, identify what directions the break can receive swell from. A north-facing Puerto Rico reef may fire on a 350-degree north swell but miss most of a 070-degree trade swell. An east-facing Barbados break may be consistent on trade swell but less exposed to northwest groundswell. Island blocking is one of the biggest reasons forecasts fail in the Caribbean — models may show swell in the general region, but a specific break can be completely shadowed by a neighboring island.
Step 2: Match Wind Direction to Swell Direction
Waves travel in the direction the generating wind is blowing. Northeast winds create southwest-moving seas. North winds create south-moving swell. East winds create west-moving waves. For a Caribbean break, the ideal storm has strong wind blowing along the break’s swell window over a long stretch of open water. The longer that fetch holds steady in one direction, the better organized the swell becomes.
Step 3: Estimate Period from Storm Strength and Distance
Short-period swell of around 5 to 8 seconds usually comes from local trades or nearby wind. Medium-period swell of around 9 to 12 seconds often comes from cold fronts or nearby tropical systems. Long-period swell of around 13 to 18 seconds usually comes from stronger storms with greater fetch or distance. Longer-period swell also travels faster. A useful rule for deep-water swell is that group speed in meters per second is roughly 0.78 times the wave period in seconds. A 15-second swell travels approximately 1,000 kilometers per day, while a 10-second swell travels about 675 kilometers per day. If a North Atlantic low is roughly 1,500 kilometers from Puerto Rico and producing 14-second swell, the first long-period lines may arrive in about a day and a half to two days.
Step 4: Check Local Wind During the Swell Window
Swell height and period only tell part of the story. Local wind determines surface quality. A strong groundswell can be rough if trades are blowing directly into the break. A smaller swell can surf excellently if the local wind is offshore or light. In many Caribbean zones, the best window is early morning before trades strengthen. After frontal passages, quality often improves once the strongest onshore wind fades while the swell remains.
Step 5: Compare Models with Buoys and Satellite Data
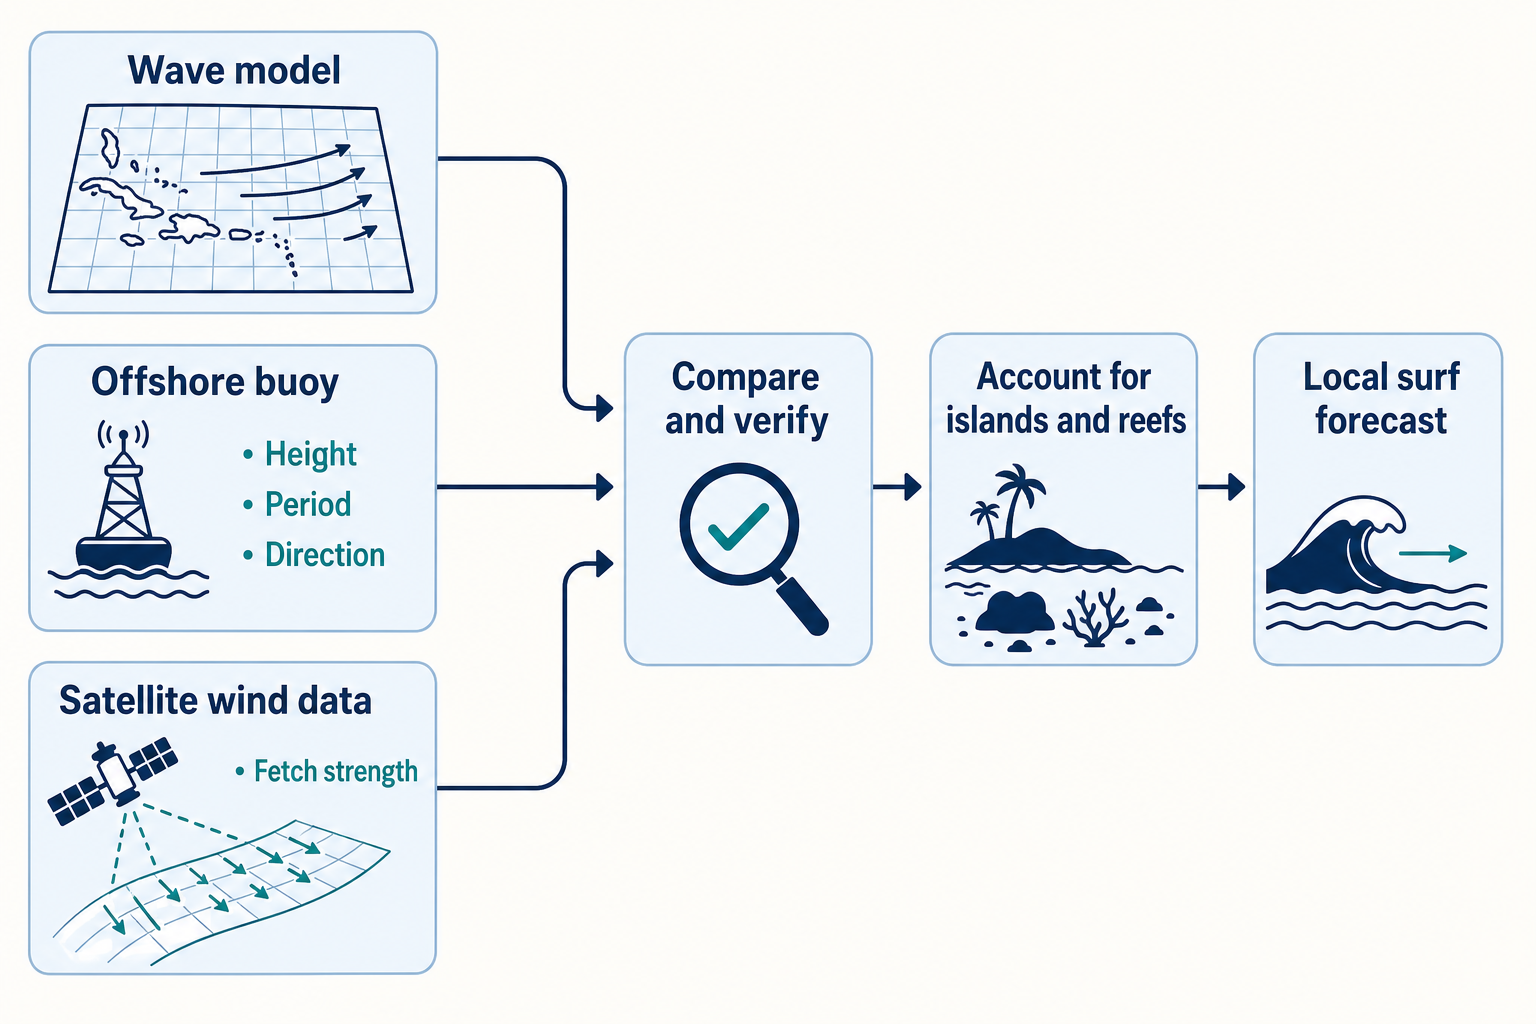
Wave models are valuable tools, but the Caribbean’s islands and reefs make local accuracy difficult. Check offshore buoys when available, particularly for swell height, period, and direction. Satellite wind data can confirm whether the storm fetch is stronger or weaker than the models predict. When buoy readings show a new long-period swell arriving before the main energy, the peak may still be hours away. A rising period usually means the swell is filling in. A falling period typically means it is becoming more local or starting to fade.
Step 6: Adjust for Reef Focus and Coastal Shape
Two breaks with the same offshore swell can produce very different surf. Reefs that concentrate swell energy can break much larger than exposed beaches nearby. Bays and points may need a precise swell direction to turn on at all. Keep notes after each swell. Record storm position, swell direction, buoy period, local wind, and what actually happened at the break. A surf log book makes it easy to track sessions over time, and the observations you build up will eventually become more useful than any regional forecast on its own. If you prefer something that can handle rough conditions, a weatherproof field notebook holds up well in humid, salty environments.
Putting It All Together: What Makes the Best Caribbean Waves?
The best Caribbean surf usually comes from a storm that is strong enough to generate organized swell, far enough away to avoid messy local wind, and positioned to send energy cleanly into an open swell window. In winter, that often means a North Atlantic low pushing north or northeast groundswell toward exposed reefs. In late summer and autumn, it may be a tropical cyclone positioned just right for a selective break. During quieter periods, persistent trade winds keep many exposed coasts consistently rideable.
Caribbean wave generation is ultimately a balance of meteorology and geography. Pressure gradients create the wind, wind over fetch creates the swell, and island shape decides where that swell becomes surf. Whether you are checking charts at home or trying to make sense of a synoptic map at a beachside café, the same principles apply. Once you learn to read storm maps with those ideas in mind, the Caribbean stops looking unpredictable and starts looking like a complex but readable system — one where the right swell is almost always out there somewhere, waiting to arrive.