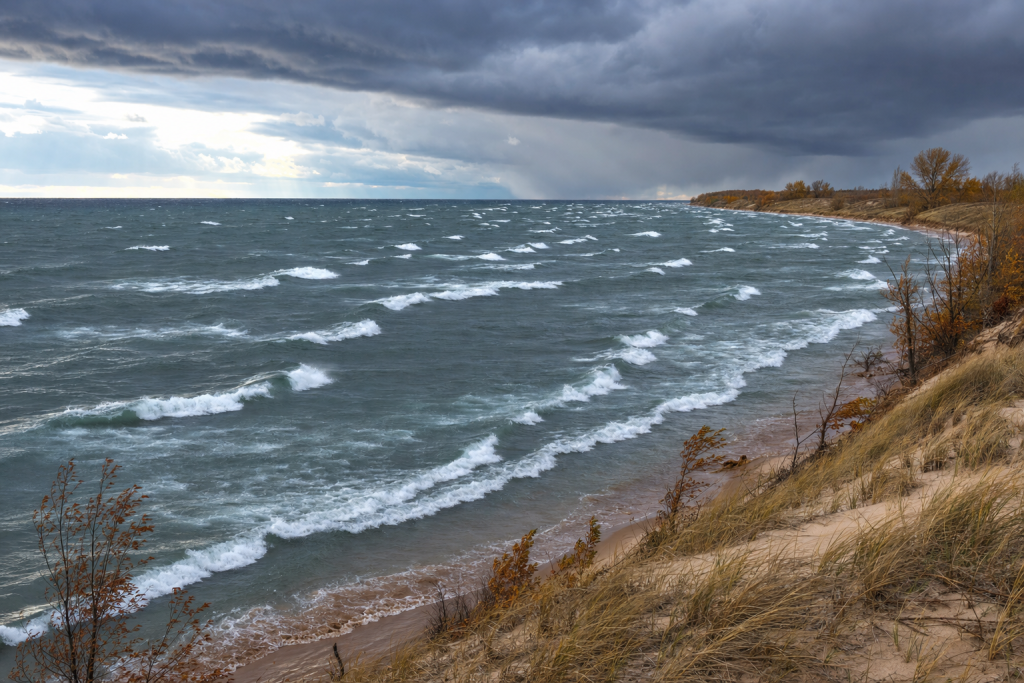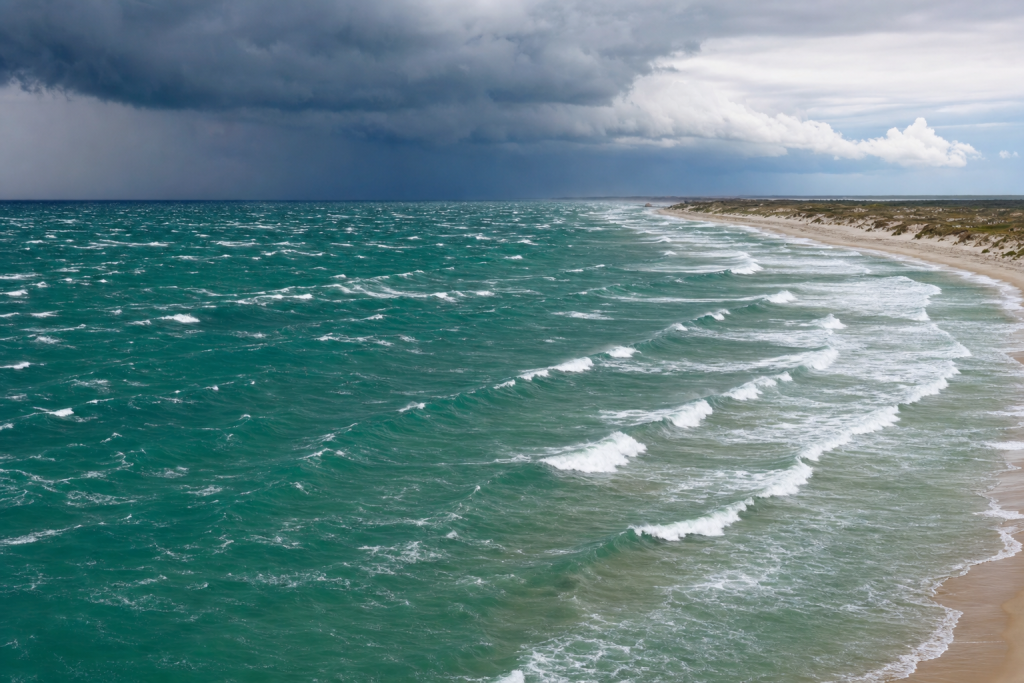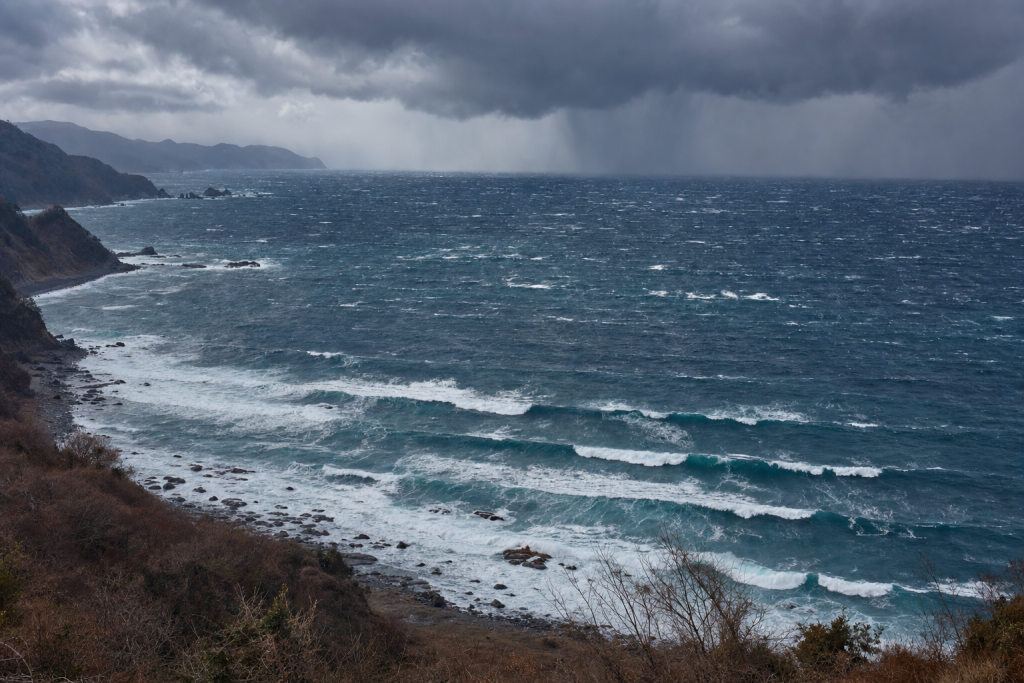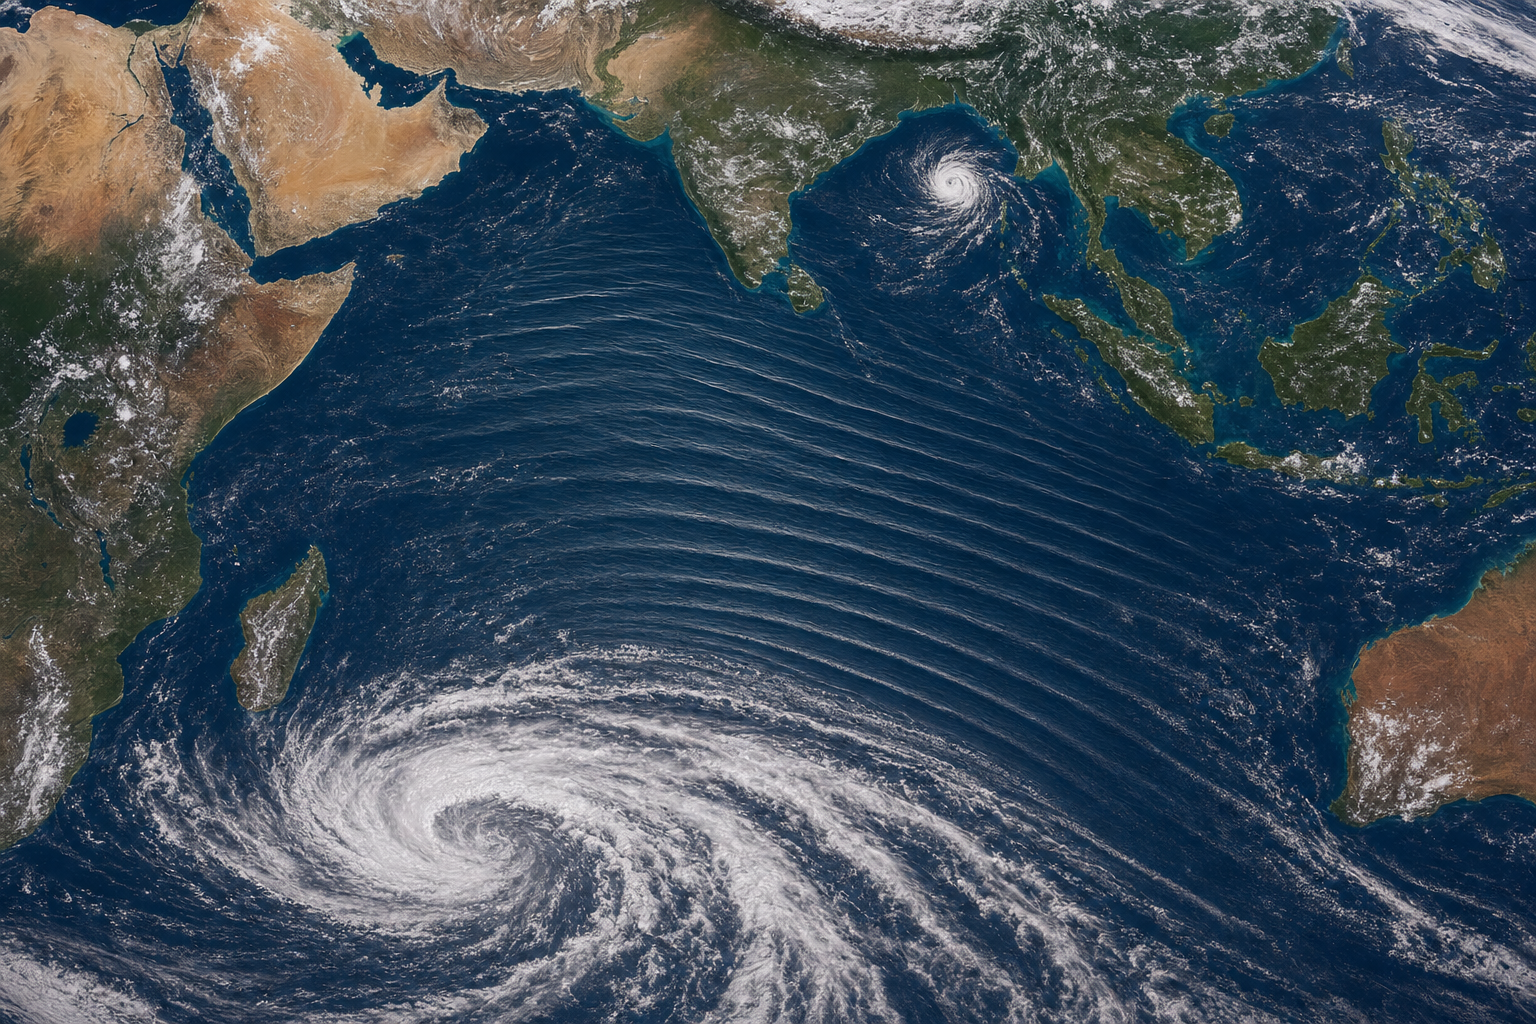
The Indian Ocean is one of the world’s great swell engines. Its southern edge is open to the Roaring Forties and Furious Fifties, where powerful low-pressure systems spin around Antarctica with very little land to interrupt them. Its northern half is shaped by monsoons, tropical cyclones, and island chains that can either focus swell into perfect reef surf or block it almost entirely. Understanding how swells are generated in the Indian Ocean helps surfers read weather maps, anticipate long-period groundswells, and appreciate why places like the Maldives, Mentawais, and Western Australia can all light up from the same broad storm belt. If you want to go deeper on the science behind all of this, this surf forecasting guide breaks down the relationship between weather patterns and wave quality in practical terms.
How Indian Ocean swells are generated
A swell begins when wind transfers energy into the sea surface. The size and quality of the resulting surf depend mainly on four ingredients: wind speed, fetch length, storm duration, and the direction the fetch is aimed. Wind speed controls how much energy enters the ocean — stronger wind produces larger waves with longer periods. Fetch is the distance over water that wind blows from a consistent direction, and a longer fetch allows waves to grow larger. Duration matters because the sea needs time to become fully developed, and storm track is crucial because a storm moving toward a surf zone can create a “captured fetch,” where the storm keeps feeding the same swell as it travels. Tracking these variables on a quality reference like a weather terminology dictionary can help you interpret forecast charts with more confidence.
Once waves leave the storm, they sort themselves by period. Long-period waves travel faster than short-period waves, so the first signs of a distant groundswell are often small but powerful lines with long waits between sets. In deep water, swell group speed is roughly:
Travel speed in kilometers per hour ≈ 2.8 × wave period in seconds
A 16-second swell can travel about 45 kilometers per hour. If a storm is 4,500 kilometers away, that swell may take just over four days to arrive. This simple rule is one of the most useful tools in Indian Ocean surf forecasting. Many surfers find it helpful to keep a surf log to track swell arrivals against storm timing so they can refine their local forecasting over time.
The main storm types that create Indian Ocean swells
Southern Ocean lows: the main source of Indian Ocean groundswell
The most important swell-producing systems for the Indian Ocean are extratropical lows in the Southern Ocean. These storms form between roughly 35°S and 60°S, where cold Antarctic air clashes with warmer subtropical air. The strong temperature contrast creates a sharp pressure gradient and powerful westerly and southwesterly winds.
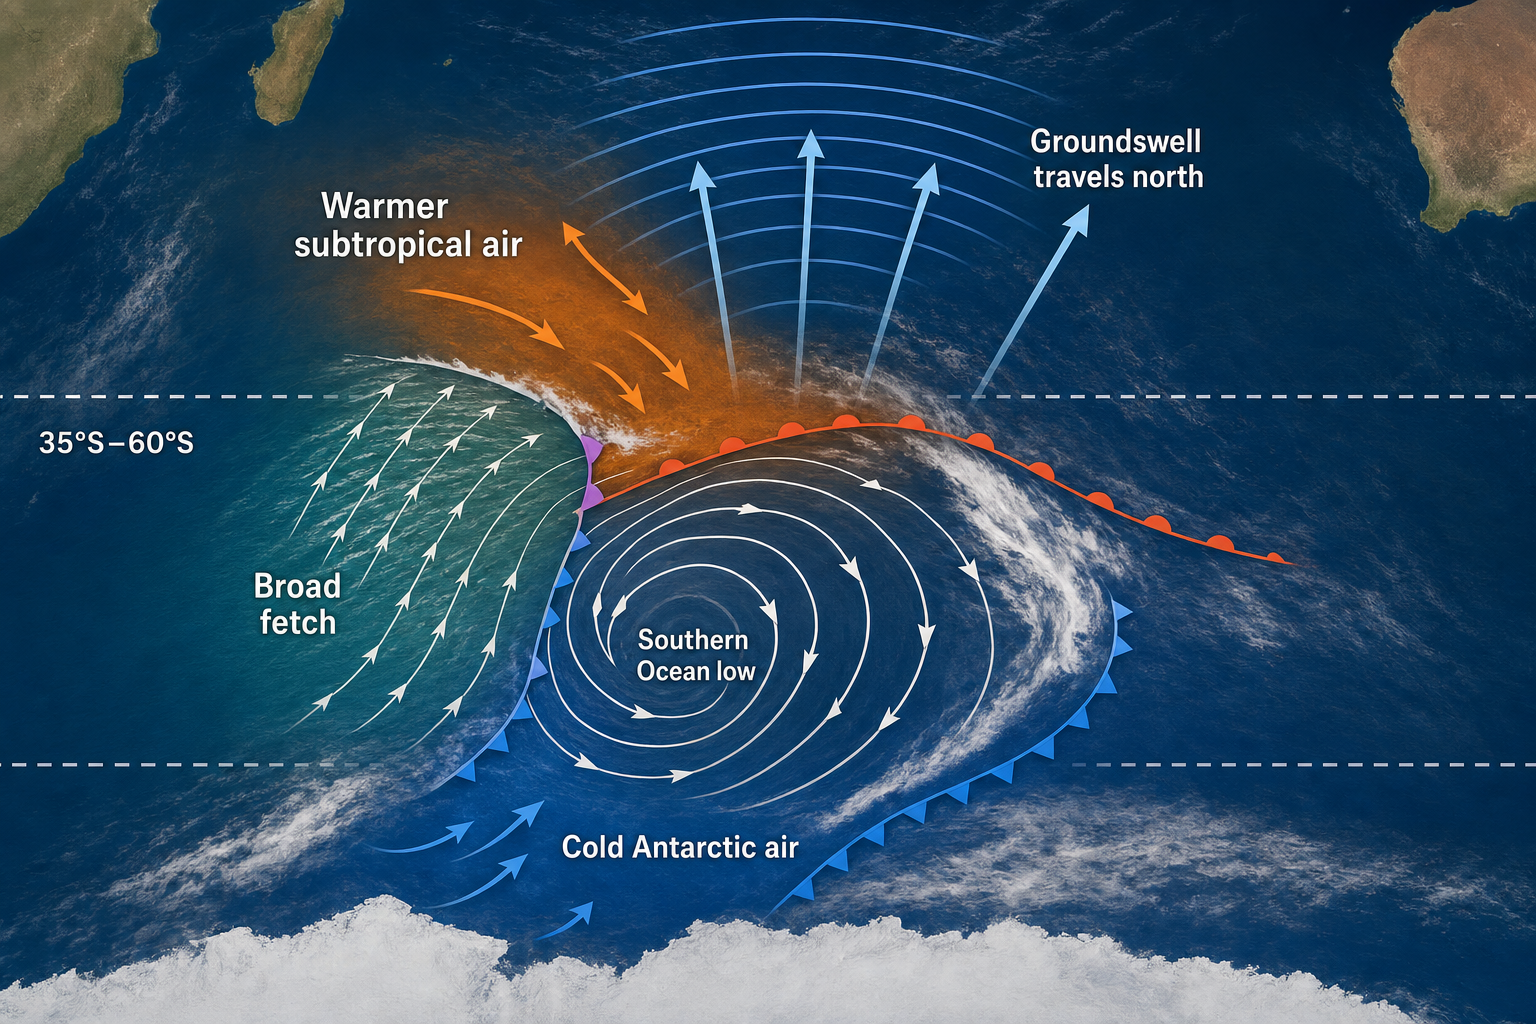
On a weather map, a classic Southern Ocean swell producer appears as a deep low-pressure center with tight, circular isobars. A cold front usually arcs northeastward from the low, and the strongest surf-producing fetch is often found on the storm’s northern or northwestern side. In the Southern Hemisphere, winds rotate clockwise around lows, so a low positioned south or southwest of a surf region can aim SW, SSW, or S swell toward Indian Ocean islands and coastlines.
Typical features of these systems include:
- Central pressure from about 940 to 990 hPa
- Nearby high pressure from about 1024 to 1040 hPa
- Wind speeds from 30 to 60 knots in strong fetches
- Swell periods commonly from 13 to 20 seconds
These storms are strongest and most frequent during the austral winter, from May to September. They send long-period groundswell to the Mentawais, Western Australia, the Maldives, Madagascar, Réunion, and South Africa. The same storm can produce very different surf depending on each coast’s exposure, bathymetry, and swell window. A portable weather station can help you monitor the local pressure trends that often precede these swell events.
Tropical cyclones: compact storms with intense swell
Tropical cyclones form over very warm water, usually where sea surface temperatures exceed about 26.5°C. They also require low vertical wind shear, moist air, and enough Coriolis force to spin. In the Indian Ocean, cyclone activity is divided into several basins: the southwest Indian Ocean near Madagascar and Réunion, the Bay of Bengal, the Arabian Sea, and the Australian region.
On a weather map, a tropical cyclone appears as a compact, circular low with tightly packed isobars around the center. Satellite imagery often shows curved bands of thunderstorms and, in stronger systems, a clear eye. Unlike Southern Ocean lows, cyclones tend to have shorter fetches. Their winds can be extreme, but because the fetch area is smaller, cyclone swells are often more directional and less consistent. When a cyclone moves slowly or tracks toward a surf zone, it can produce powerful 10 to 16-second swell — sometimes longer.
In the Southern Hemisphere, the strongest wave growth is typically found in the left-front quadrant of a moving cyclone, because the storm’s forward motion adds to the wind speed in that sector. In the Northern Hemisphere, the same effect occurs in the right-front quadrant. Keeping a waterproof field notebook on hand is useful when you’re tracking cyclone positions day by day and want a reliable way to record observations.
Monsoon and trade-wind systems: consistent but shorter-period swell
The Indian Ocean is heavily shaped by the monsoon. During the boreal summer, from June to September, intense heating over Asia creates low pressure over the continent. Air flows from the southern Indian Ocean toward that low, producing the southwest monsoon over the Arabian Sea and India.
This monsoon flow can generate broad areas of WSW to SW wind swell for India’s west coast. Periods are usually shorter than Southern Ocean groundswell — commonly 7 to 12 seconds — but the swell can be very consistent. Farther south, the Mascarene High drives southeast trade winds toward Madagascar, the Seychelles, and East Africa. These trades produce frequent SE swell, especially from May to October. The surf is often smaller and windier than long-period groundswell, but it can be reliable at exposed reefs and beaches.
Seasonal patterns in Indian Ocean swells
| Season | Main swell sources | Typical swell periods | General surf character |
|---|---|---|---|
| March to May | Early Southern Ocean lows, tropical cyclones, light-wind transition patterns | 10 to 18 seconds | Often clean and favorable in the Maldives, Mentawais, and parts of Indonesia |
| June to September | Strong Southern Ocean lows, southwest monsoon, southeast trades | 8 to 20 seconds | Most consistent groundswell season for the southern and central Indian Ocean |
| October to November | Late Southern Ocean lows, Bay of Bengal cyclones, Arabian Sea cyclones | 9 to 18 seconds | Good shoulder season with cleaner winds in many regions |
| December to February | Tropical cyclones, weaker Southern Ocean lows, local wind systems | 8 to 16 seconds | Less consistent for classic groundswell zones, but cyclone swells can be excellent |
How Indian Ocean swells affect the Maldives
The Maldives sit north of the equator, but their best surf is generated far to the south. Long-period Southern Ocean swells travel north and arrive from the S, SSE, or SE, depending on the storm position and island exposure. The atolls filter and refract swell significantly, so two breaks only a short distance apart can differ greatly in size and shape.
Maldives swell direction, height, and period
The main surf season runs from March to October, with the most consistent swell from April to September. Typical exposed reef surf ranges from 2 to 8 feet on the face, and larger pulses can push beyond that in the southern atolls.
| Season | Main swell direction | Typical height | Typical period | Wave quality |
|---|---|---|---|---|
| March to May | SE to S | 2 to 6 ft faces | 12 to 18 sec | Often clean with lighter winds |
| June to September | SSE to SSW | 3 to 8 ft faces | 13 to 19 sec | Very consistent, though wind varies by atoll |
| November to February | Small SE or local NE | 1 to 4 ft faces | 8 to 14 sec | Cleaner but less consistent |
Southern atolls are more exposed to S and SSW swell, while North Malé and Central Atolls often prefer SE to S swell. Very westerly Southern Ocean swells may pass under or around the chain with less energy at some breaks. Understanding the island chain’s geometry is key — a detailed world atlas can help you visualize swell paths across the region.
How Indian Ocean swells affect the Mentawais
The Mentawai Islands off western Sumatra are one of the best examples of Southern Ocean swell energy being perfectly aimed into tropical reef setups. The islands face the open southeast Indian Ocean, giving them an excellent swell window toward the Roaring Forties.
Mentawais swell direction, height, and period
The prime Mentawais season is April to October. Strong Southern Ocean lows send SSW to SW groundswell, commonly in the 14 to 20-second range. Exposed reefs can be head-high to triple overhead during large events, while more protected breaks remain manageable.
| Season | Main swell direction | Typical height | Typical period | Wave quality |
|---|---|---|---|---|
| March to May | SSW to SW | 3 to 8 ft faces | 13 to 18 sec | Excellent with more variable winds |
| June to September | SW to SSW | 4 to 12 ft faces | 14 to 20 sec | Powerful and consistent |
| November to February | Small SSW or local wind swell | 2 to 5 ft faces | 9 to 15 sec | Less consistent but often still surfable |
Storms tracking eastward below South Africa and across the central southern Indian Ocean are especially productive for the Mentawais. A strong fetch around 40°S to 50°S aimed northeast toward Indonesia is the classic setup. Monitoring barometric trends at home before a trip can pay off — a marine barometer is a simple tool that helps you gauge approaching pressure changes.
How Indian Ocean swells affect Western Australia
Western Australia receives some of the most powerful surf in the Indian Ocean. The southwest coast is fully open to long-period swell from the Southern Ocean, while the northwest coast can receive tropical cyclone swell during the warm season.
Southwest Western Australia swell patterns
Margaret River and nearby coasts are exposed to WSW, SW, and SSW swell from deep lows passing south of the continent. Winter is the biggest season, though spring and autumn often offer cleaner, more organized conditions.
| Season | Main swell direction | Typical height | Typical period | Wave quality |
|---|---|---|---|---|
| April to June | SW to WSW | 4 to 12 ft faces | 12 to 18 sec | Powerful with good offshore windows |
| July to September | WSW to SW | 6 to 15 ft+ faces | 13 to 19 sec | Large and consistent, often stormy |
| December to March | SW groundswell or cyclone swell in the north | 2 to 8 ft faces | 9 to 16 sec | Cleaner in the southwest, episodic in the northwest |
For the northwest, tropical cyclones forming off the Pilbara coast or in the eastern Indian Ocean can send N, NW, or W swell into exposed reefs. These swells are less predictable than winter Southern Ocean surf because cyclone tracks vary considerably from year to year. When you’re surfing remote stretches of Western Australia’s coast, having a handheld marine VHF radio on hand is a smart safety measure, especially during active weather.
How Indian Ocean swells affect India
India has two very different surf regimes. The west coast faces the Arabian Sea and is strongly shaped by the southwest monsoon, while the east coast faces the Bay of Bengal and receives cyclone swell, northeast monsoon swell, and local wind swell.
India west coast swell patterns
From June to September, the southwest monsoon creates persistent WSW to SW wind swell along Kerala, Karnataka, and Goa. Heights commonly range from 2 to 6 feet on exposed beaches, with periods from 7 to 12 seconds. Conditions can be messy during active monsoon weather, but cleaner windows appear during lulls or early morning land breezes.
Arabian Sea cyclones are most likely before and after the monsoon — particularly May to June and October to November. These systems can produce more organized W, SW, or NW swell with periods from 10 to 16 seconds. Wind readings during these transition windows can vary quickly, and a handheld anemometer is a practical way to track what’s actually blowing at the beach.
India east coast swell patterns
The east coast is most responsive to Bay of Bengal cyclones. The strongest surf events tend to occur in April to May or October to December, when cyclones or deep depressions send E, SE, or NE swell toward Tamil Nadu, Andhra Pradesh, and Odisha. Typical surf during cyclone swell can range from 3 to 8 feet on exposed beaches, with periods from 9 to 15 seconds. Northeast monsoon wind swell from October to January is usually smaller and shorter-period, but it can be quite consistent.
How Indian Ocean swells affect Madagascar
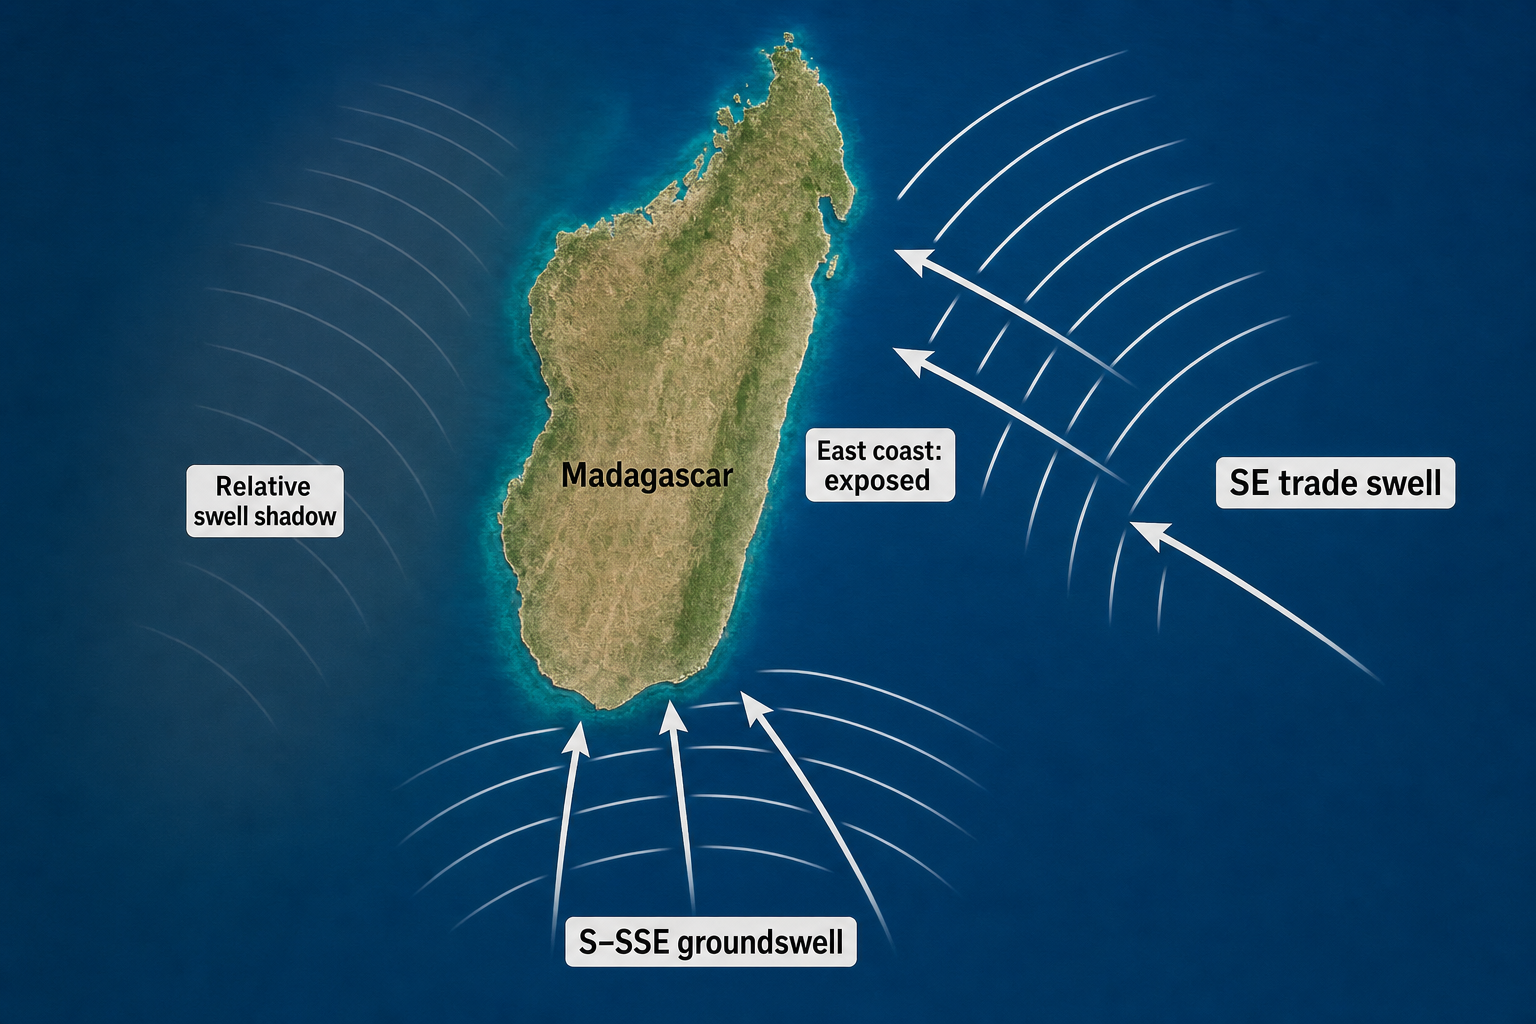
Madagascar divides the southwest Indian Ocean into exposed and shadowed zones. The east coast faces the open ocean and receives SE trade swell, tropical cyclone swell, and long-period S to SSE groundswell. The southwest and southern coasts are better positioned for Southern Ocean energy.
Madagascar swell direction, height, and period
| Season | Main swell direction | Typical height | Typical period | Wave quality |
|---|---|---|---|---|
| May to September | S to SW in the south, SE on the east coast | 3 to 10 ft faces | 10 to 18 sec | Most reliable for groundswell |
| November to April | E to NE cyclone swell | 3 to 12 ft faces | 10 to 16 sec | Powerful but episodic |
| Shoulder seasons | SSE to SE | 2 to 6 ft faces | 9 to 15 sec | Often more manageable |
Cyclones forming east or northeast of Madagascar can create strong easterly swell for the exposed east coast. Southern Ocean lows passing below South Africa or south of Madagascar send cleaner, longer-period energy into the south. A solid understanding of how ocean systems interact with island geography pays off here — this oceanography textbook covers the physical principles behind swell propagation and coastal interaction in useful detail.
How Indian Ocean swells affect South Africa
South Africa’s Indian Ocean-facing coast is powered mainly by Southern Ocean lows, cut-off lows, coastal lows, and occasional tropical systems in the Mozambique Channel. The south and southeast coasts receive strong SW to S groundswell, while KwaZulu-Natal also responds to E and NE swell sources.
South Africa swell direction, height, and period
Winter, from May to August, is the classic season for strong groundswell and offshore wind patterns. Deep lows south of the country produce SSW to SW swell with periods from 12 to 18 seconds. Surf can range from 4 to 12 feet on exposed coasts, with larger conditions at open-water reefs and points.
Summer brings more NE wind swell along KwaZulu-Natal and occasional tropical cyclone swell from the Mozambique Channel. These events can send E to NE swell with periods from 9 to 15 seconds. Quality depends heavily on local wind direction and the exact position of the generating storm.
How Indian Ocean swells affect the Seychelles Islands
The Seychelles sit in the western tropical Indian Ocean, north of Madagascar. They are far from the main Southern Ocean storm belt and partly shadowed from long-period southern swells. As a result, surf is usually smaller and more dependent on trade-wind swell, monsoon wind swell, and occasional tropical disturbances.
Seychelles swell direction, height, and period
From May to October, southeast trades produce SE swell with periods from 8 to 12 seconds. Exposed reefs and beaches may see 2 to 5-foot faces, though wind exposure can affect quality. From December to March, the northwest monsoon creates smaller NW wind swell, often in the 1 to 4-foot range.
The best conditions often occur during transition months, when winds are lighter and mixed swell sources are still active. Long-period Southern Ocean swell can occasionally reach exposed southern and eastern shores, but it is less consistent here than in the Maldives or Réunion.
How Indian Ocean swells affect Réunion Island
Réunion is one of the most swell-exposed islands in the southwest Indian Ocean. Its position near 21°S allows it to receive Southern Ocean groundswell in winter and tropical cyclone swell in summer.
Réunion swell direction, height, and period
| Season | Main swell direction | Typical height | Typical period | Wave quality |
|---|---|---|---|---|
| May to October | SSW to SSE | 4 to 12 ft faces | 12 to 18 sec | Strong groundswell season |
| November to April | E to NE cyclone swell | 3 to 12 ft faces | 10 to 16 sec | High quality when wind cooperates |
| Transition months | SE to S | 2 to 8 ft faces | 10 to 16 sec | Often clean and varied |
The southeast trades can add texture to exposed coasts, but the island’s shape creates many wind-protected options. Cyclones tracking east, north, or northeast of Réunion can produce powerful, directional swell that arrives much faster than distant Southern Ocean energy. Staying connected to weather alerts during active periods is valuable — a NOAA weather alert radio is a reliable way to monitor developing storm warnings.
How Indian Ocean swells affect East Africa
East Africa’s coastline runs from Somalia and Kenya through Tanzania and Mozambique. Madagascar blocks much of the direct Southern Ocean energy from reaching the northern part of this region, so surf is largely driven by trade-wind swell, monsoon patterns, and tropical systems.
East Africa swell direction, height, and period
From May to October, southeast trades generate SE to ESE swell. Exposed parts of Kenya and Tanzania commonly see 2 to 5-foot surf with periods from 8 to 12 seconds. Local reefs, tidal range, and wind exposure strongly influence quality.
Mozambique has a better swell window, especially in the south. It can receive S to SE groundswell wrapping in from Southern Ocean lows, as well as E or NE cyclone swell from the Mozambique Channel. Southern Mozambique and northern South Africa can see 3 to 8-foot surf during stronger events, with periods from 10 to 16 seconds.
The regional monsoon names are worth knowing for forecasting purposes. The kusi is the southeast monsoon, strongest from June to September, and it produces more consistent surf. The kaskazi is the northeast monsoon, most active from December to March. The kusi often brings onshore wind to exposed east-facing beaches, so positioning matters a lot when choosing where to surf along this coast.
What Indian Ocean swell-producing storms look like on weather maps
Reading Southern Ocean swell maps
Look for a deep low south or southwest of the target coast, with a broad fetch aimed along the great-circle path toward the surf zone. The best storms usually show tight isobars spread over a large area, not just a small patch of strong wind. A strong high-pressure system north of the low can increase the pressure gradient and strengthen the fetch further.
For the Mentawais and Maldives, the ideal fetch is often in the central or eastern southern Indian Ocean aimed northeast. For Western Australia, lows south or southwest of the continent are more direct. For South Africa, lows passing south of the country can send strong SW to S swell up the coast. Learning to read isobar spacing and interpret pressure systems is a skill worth developing — this nautical chart guide is a good reference for understanding how to interpret weather and ocean charts together.
Reading tropical cyclone swell maps
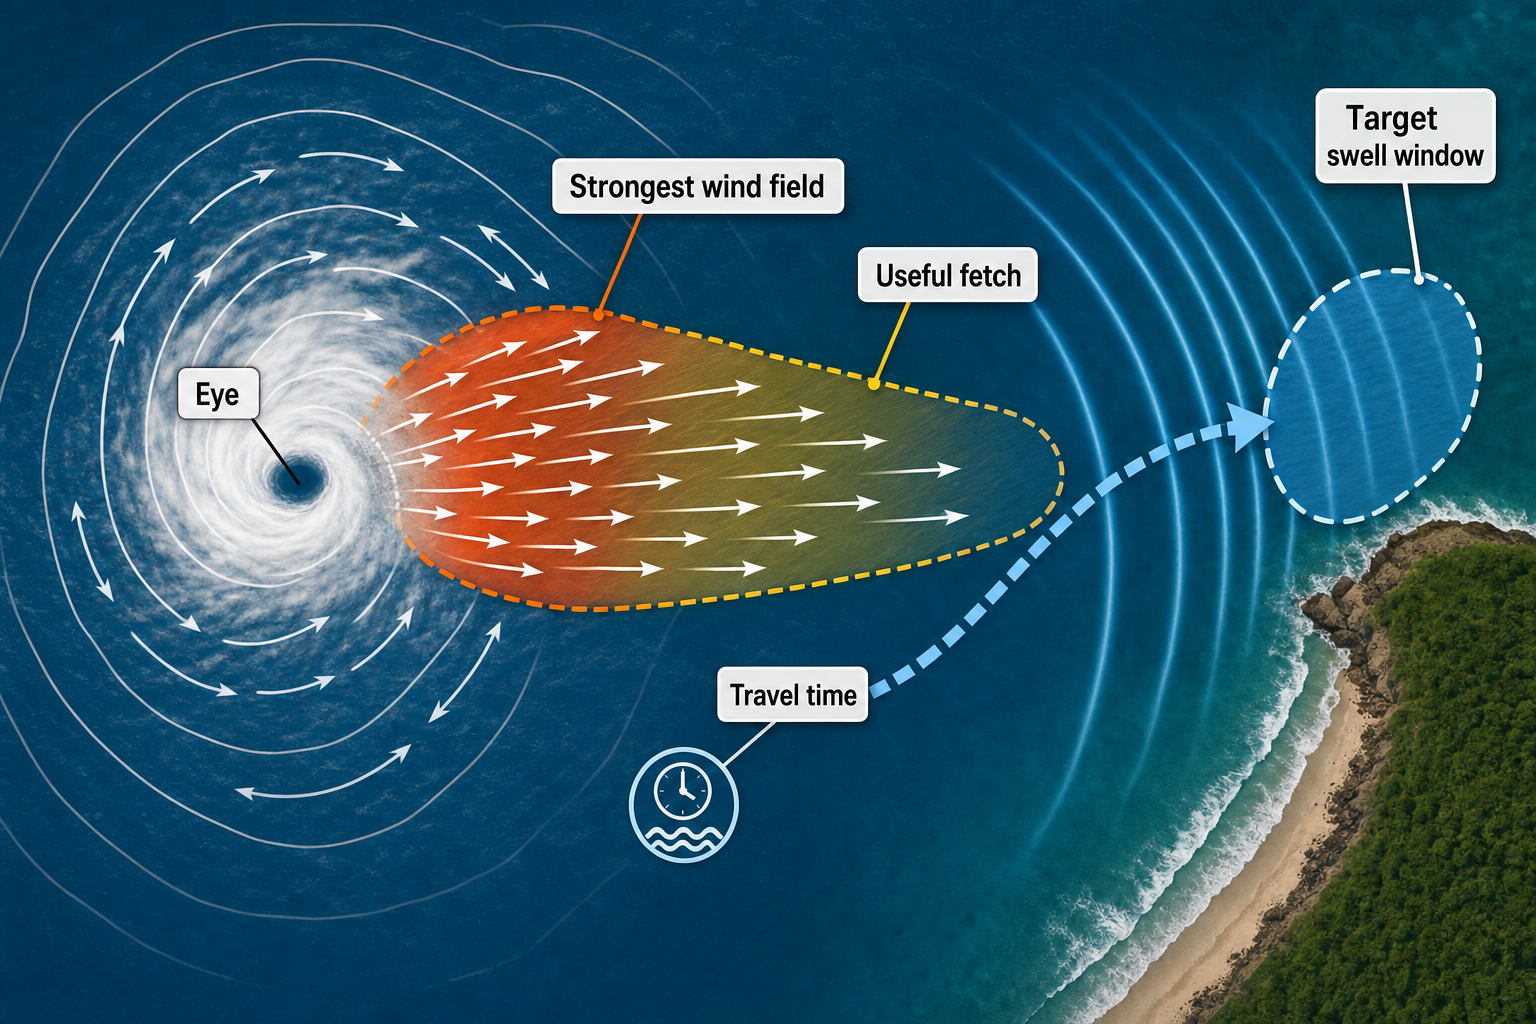
For cyclone swell, storm position and movement matter more than central pressure alone. A very intense cyclone may produce little surf at a given break if its strongest winds are aimed away from it. A weaker but slow-moving cyclone with a well-aimed fetch can often be a better swell producer.
On the map, focus on the wind field around the cyclone rather than just the eye location. The most useful fetch is the area of strongest wind blowing toward the swell window consistently over several hours or more. Also consider travel time — cyclone swells generated nearby may arrive in less than a day, while swells from distant systems can take several days. A coastal navigation chart can help you plot storm positions and estimate swell travel angles more precisely.
Reading monsoon and trade-wind swell maps
Monsoon and trade-wind swells come from broad pressure patterns rather than compact storms. Look for a strong high-pressure cell in the southern Indian Ocean paired with lower pressure over Asia or equatorial regions. The resulting pressure gradient can create long swaths of 20 to 35-knot wind. These systems typically produce shorter-period swell — forecast charts may show large areas of 1 to 3-meter sea states, but the resulting surf is often less powerful than a 1.5-meter, 16-second groundswell from a distant Southern Ocean storm. Keeping your charts protected while working outdoors is straightforward with a waterproof map case.
How to forecast waves from Indian Ocean storms
Step 1: Identify the swell source
Start by determining whether the swell is coming from a Southern Ocean low, a tropical cyclone, or a monsoon and trade-wind system. Each source has a different period range and reliability. Southern Ocean lows produce the longest-period groundswell. Cyclones produce powerful but more directional swell. Monsoon and trade systems produce shorter-period, more wind-affected surf.
Step 2: Check the swell window
Every surf zone has a limited swell window. The Mentawais need SSW to SW swell. The Maldives often prefer SE to S swell. Southwest Western Australia handles WSW to SW energy best. East Africa is partly shadowed by Madagascar, so direct SSW groundswell may not reach many breaks. Use a map or great-circle tool to trace the path from the storm fetch to the coast. If land blocks the path, the swell may be reduced or absent. Islands, continental shelves, and underwater ridges can also bend or focus energy.
Step 3: Estimate size from wind, fetch, and duration
A small area of 50-knot wind may produce less surf than a large area of 35-knot wind blowing for two days. For distant groundswell, look for a fetch at least several hundred kilometers long aimed consistently at the target coast. The largest Indian Ocean swells often come from fetches over 1,000 kilometers long.
Step 4: Estimate arrival time from period
Use the deep-water travel rule: kilometers per hour ≈ 2.8 × period. Long-period energy arrives first. If a model shows 18-second swell generated 4,000 kilometers away, the leading edge could arrive in roughly three and a half days. The peak of the swell may arrive later, depending on how long the storm lasted and how far the fetch extended.
Step 5: Adjust for local wind, tide, and bathymetry
Swell is only half the forecast. Local wind determines whether waves are clean or choppy. Tide controls many reefs, especially in the Maldives, Mentawais, and East Africa. Bathymetry can transform a modest swell into a powerful reef wave, or cause a large swell to miss the best section of a coastline entirely.
Step 6: Compare model guidance with observations
Modern forecast models are excellent, but not perfect. Satellite altimeters, scatterometer wind data, buoy readings, and coastal observations all help confirm whether a storm produced the expected swell. If a Southern Ocean storm verifies stronger than modeled, long-period swell may exceed the forecast several days later. Referencing a solid regional waterproof map alongside digital tools helps you stay oriented when cross-referencing storm positions with potential surf destinations.
Key takeaways for Indian Ocean swell forecasting
The Indian Ocean is shaped by three main swell engines: Southern Ocean lows, tropical cyclones, and monsoon and trade-wind systems. Southern Ocean storms produce the classic long-period groundswell that powers the Mentawais, Western Australia, the Maldives, Réunion, Madagascar, and South Africa. Tropical cyclones add intense, directional swell during the warm season — especially near Madagascar, Réunion, India, and northwest Australia. Monsoon and trade winds provide consistency for India, East Africa, the Seychelles, and many exposed tropical coasts.
The best forecasts come from reading the storm first, not just the surf number. Look at the pressure pattern, the wind field, the fetch direction, and the distance to the break. Then adjust for swell window, local wind, tide, and coastal shape. Once you understand how Indian Ocean swells are generated, a weather map stops being an abstract chart and becomes a preview of where the next great waves will arrive. For anyone serious about improving their forecasting skills, this wave forecasting guide is a worthwhile companion to what you’ve learned here — it connects the meteorology to the water in a way that’s genuinely useful for surfers at any level.