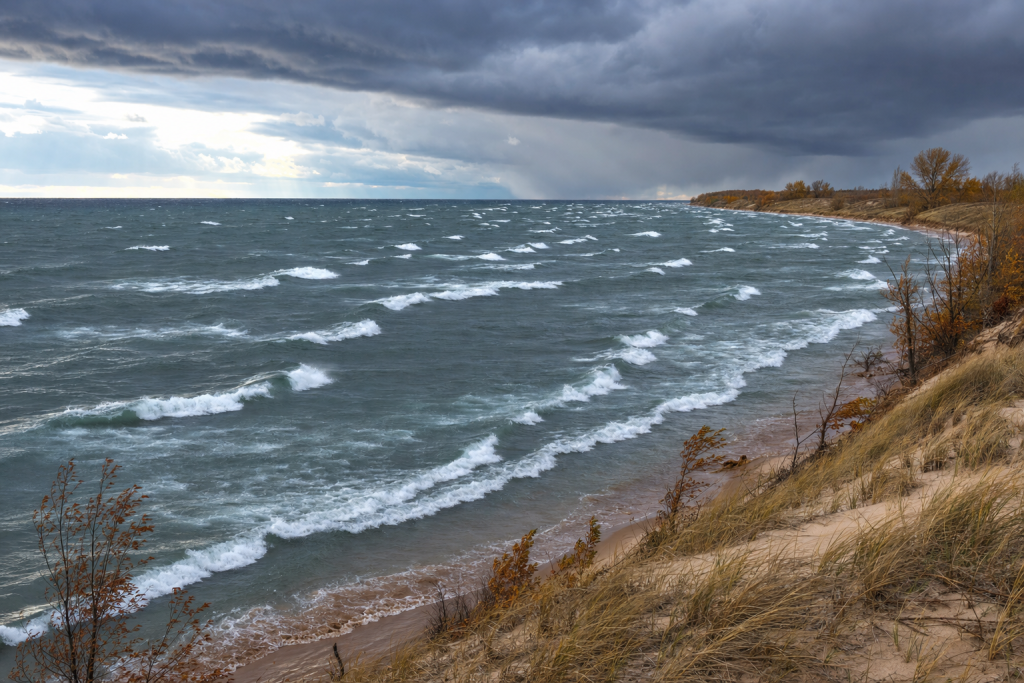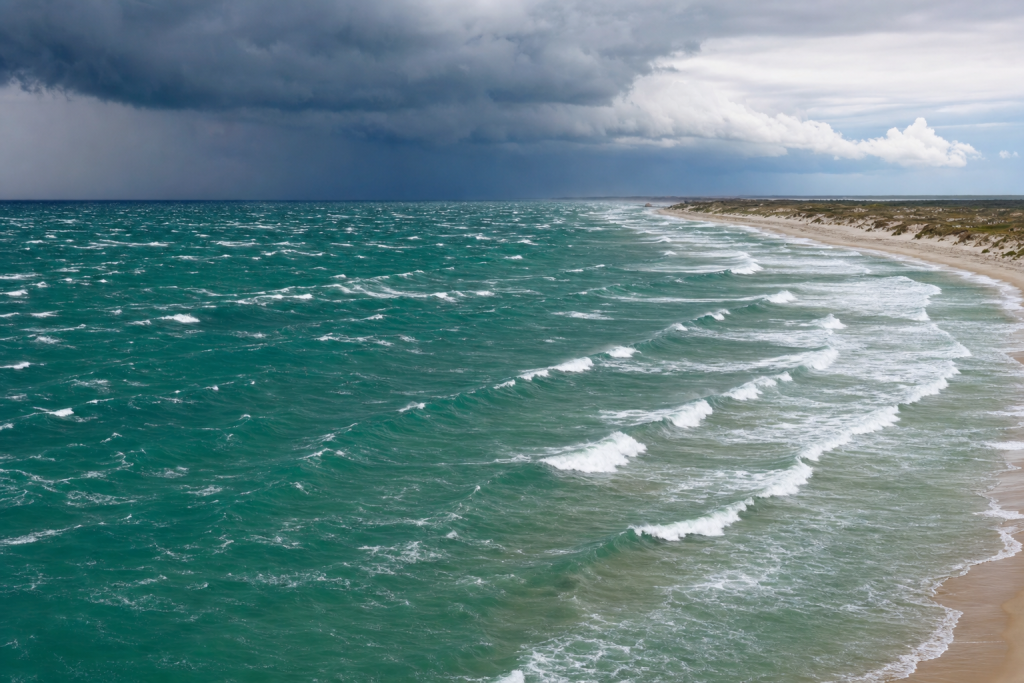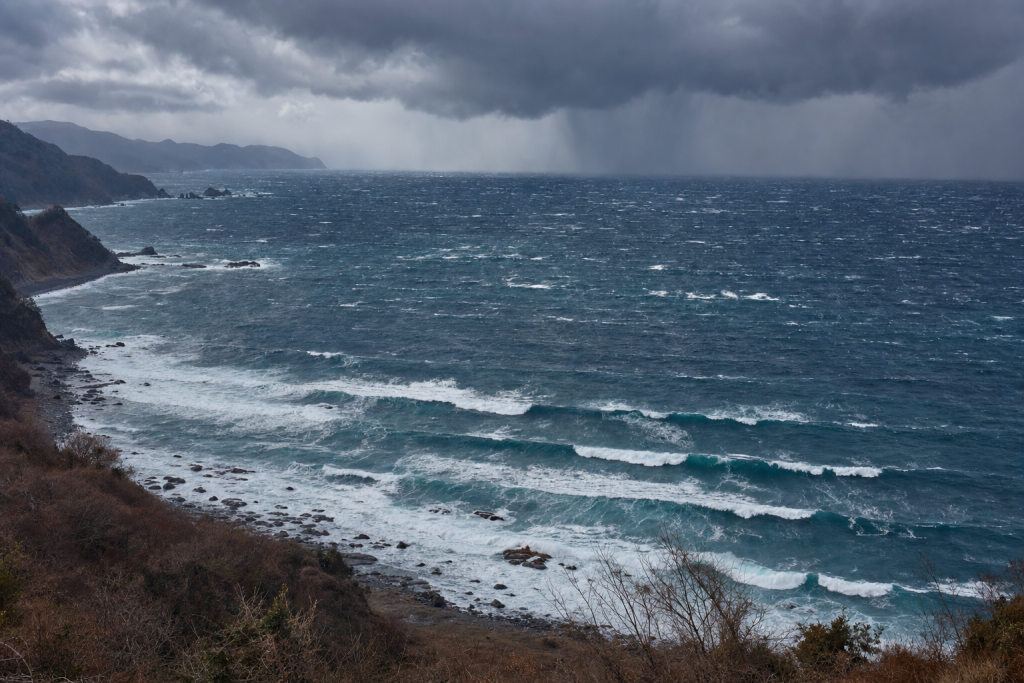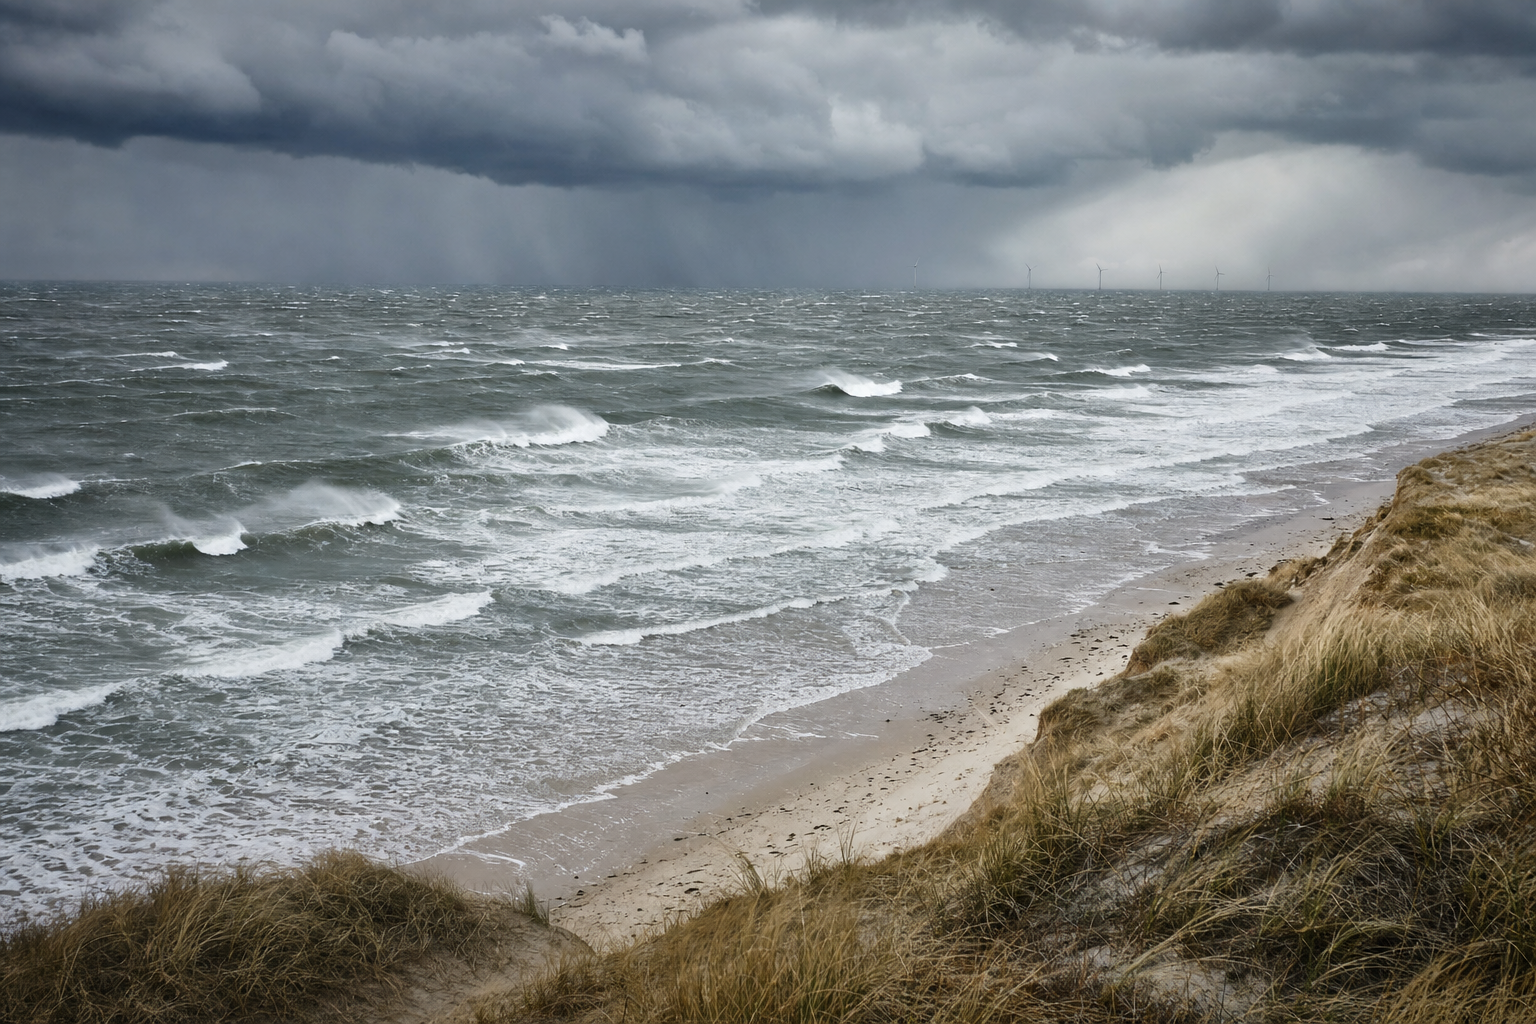
The North Sea can look deceptively small on a map compared with the Atlantic, but it’s one of Europe’s most fascinating surf environments. It’s shallow, consistently stormy, tide-dominated, and surrounded by coastlines that face every direction. North Sea waves are often short-period and wind-driven, yet the right storm track can turn this compact basin into a genuine wave machine. Understanding how these waves are generated helps surfers read weather maps, judge swell quality, and know when a messy gale might open into a clean surf window. If you want to go deeper on the science behind it all, this surf forecasting guide is a solid companion for building that knowledge. For tracking atmospheric patterns that drive these storms, having a wireless weather station with barometric pressure display at home can help you spot the setups before they arrive.
How North Sea waves are generated
North Sea waves form when wind transfers energy into the sea surface. The longer and harder the wind blows over open water, the more the surface grows from ripples into organized waves. Three ingredients matter most: wind speed, duration, and fetch length.
Wind speed: the engine of North Sea swell
Wind speed controls how much energy enters the water. A light breeze may texture the surface, but it won’t create meaningful surf. In the North Sea, the following rough guide is useful:
- 15 to 20 knots: small surf if the fetch is well aligned.
- 20 to 30 knots: surfable wind swell at exposed coasts.
- 30 to 40 knots: solid North Sea surf, often head-high or larger at open beaches.
- 40 knots and above: large storm surf, especially when the wind blows over a long fetch for many hours.
Because the North Sea is fetch-limited, it generally needs stronger wind than an open-ocean swell source to produce comparable wave height and period.
Fetch: why storm direction matters in the North Sea
Fetch is the distance over water that wind blows in a consistent direction. The North Sea is roughly aligned north to south, so northerly and southerly fetches can travel a long way down the basin. East-west fetches are shorter, but they can still generate punchy surf for coasts facing directly into the wind.
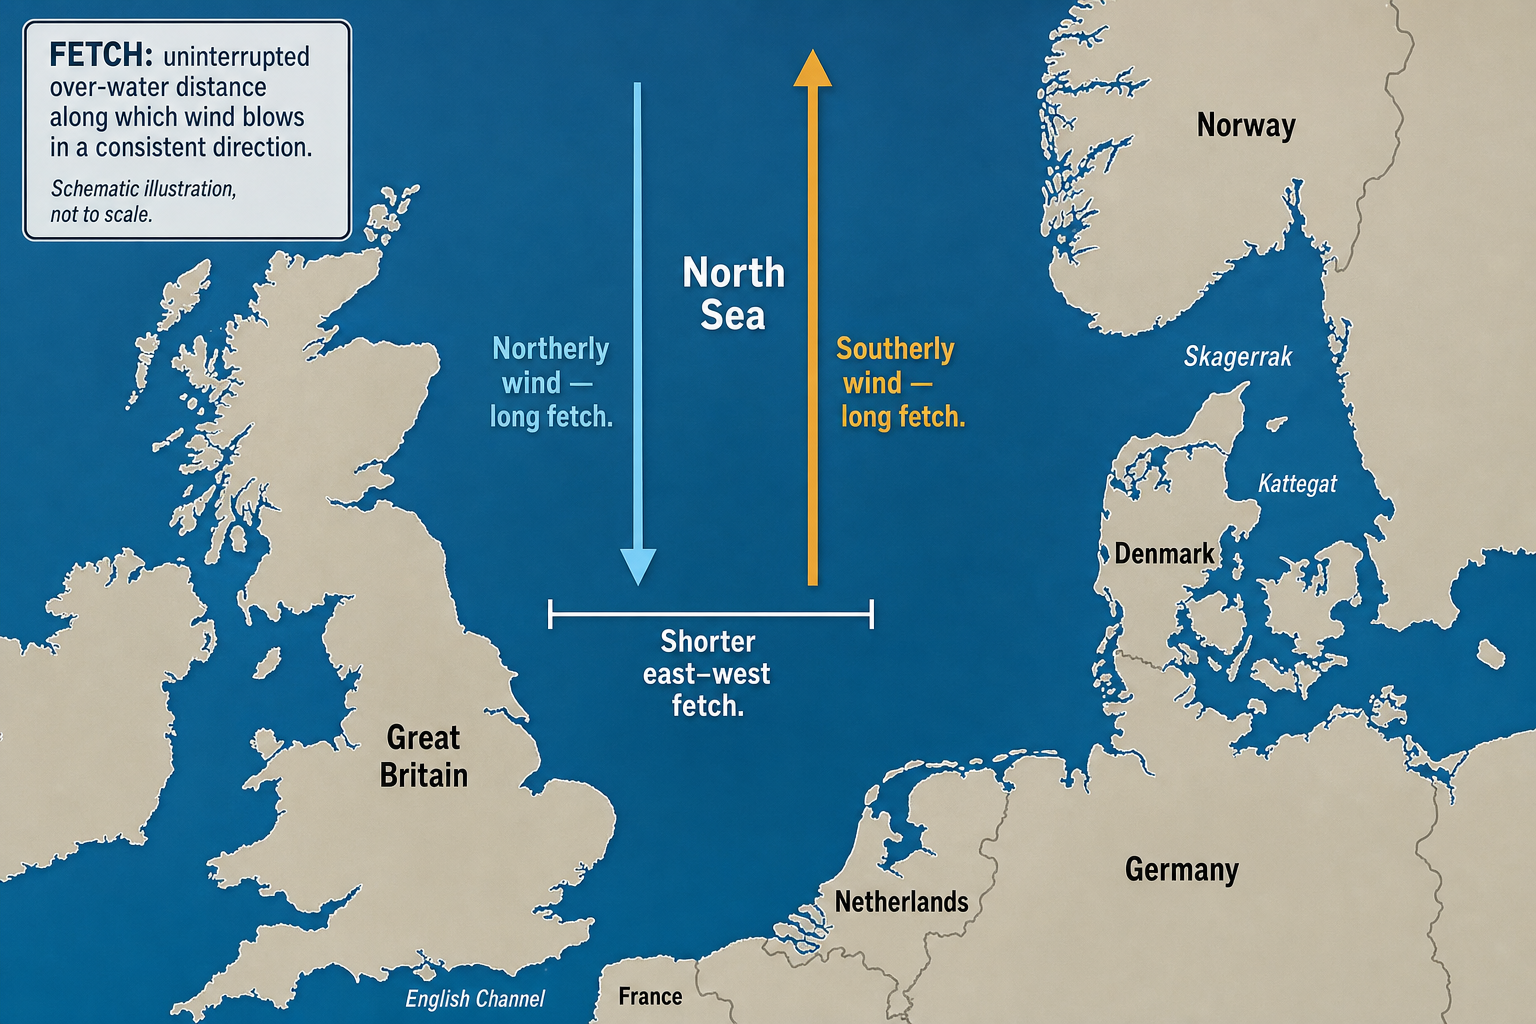
This is why a northerly gale can create good waves for the UK east coast while a westerly gale produces surf for Denmark and the Netherlands. The same storm may deliver excellent conditions on one coastline and almost nothing on another. A good world atlas helps put the North Sea’s fetch geometry into geographic context when you’re first learning to read these patterns.
Duration: why slow-moving North Sea storms are better
A short burst of strong wind creates steep, chaotic waves. A slower-moving storm gives the sea more time to build. In the North Sea, six hours of sustained wind may be enough for small surf, but 12 to 24 hours is far better. Multi-day gales can produce the largest waves, though quality often depends on whether local wind relaxes afterward.
Wave period: why North Sea surf feels different from Atlantic surf
Wave period is the time between successive wave crests. Longer-period waves travel faster, carry more energy, and typically form cleaner lines. Atlantic groundswell often arrives at 12 to 18 seconds. North Sea waves run shorter because the basin is much smaller.
Typical North Sea surf periods are:
- 4 to 6 seconds: weak local wind swell.
- 6 to 8 seconds: common surfable North Sea swell.
- 8 to 11 seconds: good North Sea swell with noticeably more push.
- 11 to 13 seconds: uncommon, usually from a strong northern storm or Atlantic-influenced swell.
A 7-second North Sea swell can still be genuinely fun, especially on a good sandbar, but it won’t behave like a 14-second ocean swell. It will peak more quickly, fade faster, and be far more sensitive to local wind conditions.
The North Sea’s shape and depth control wave quality
The North Sea is not a deep open ocean. Much of the southern and central basin is shallow, with broad banks such as Dogger Bank influencing how waves move and organize. The northern North Sea is deeper, particularly near the Norwegian Trench, but waves still feel the seabed’s influence as they approach shore.
Shallow water makes North Sea waves steep
As waves enter shallower water they slow down and steepen. Since much of the North Sea is already relatively shallow, storm waves often become short, peaky, and jumbled. This is one key reason North Sea surf can be powerful but disorganized during an active storm.
Sandbanks and tidal currents shape North Sea surf
Many North Sea surf spots depend entirely on sandbars. These banks focus wave energy, create peaks, and shift significantly after storms. Tidal currents matter just as much. An opposing tidal stream can make waves steeper and hollower, while a following tide can flatten the surf considerably.
This is especially important where tidal ranges are large, such as the UK east coast and the southern North Sea. A forecast may show enough swell, but the best surf often only happens during a narrow tide window. For understanding coastal water movements and seabed features, this guide to reading nautical charts is genuinely useful, and a coastal navigation training chart can help you practice identifying the relevant features.
Main North Sea storm types that create surf
Most North Sea surf comes from extratropical low-pressure systems — the familiar Atlantic and European depressions visible on weather maps, with fronts wrapped around a low center. The best storms are not always the deepest ones. What matters most is whether the pressure pattern creates strong, sustained wind over the right part of the sea. Brushing up on weather terminology with a reference like this weather terms dictionary makes pattern recognition much easier.
Northerly North Sea storms
A northerly setup is one of the classic swell makers for the UK east coast. Depending on the angle, it can also send waves into parts of the Netherlands, northern Germany, and Denmark.
On a weather map, this pattern typically shows low pressure over Scandinavia, the Baltic, or the Norwegian Sea, with higher pressure to the west of the UK. The isobars run roughly north to south down the North Sea. Because wind flows anticlockwise around lows in the Northern Hemisphere, this drives northerly or north-northeasterly wind down the basin.
Typical surf from a northerly storm:
- Swell direction: N to NE.
- Open-water wave height: 2 to 5 metres in strong events.
- Surf height: waist-high to well overhead at exposed coasts.
- Peak period: usually 7 to 11 seconds.
- Quality: messy during the gale, better when local wind turns offshore or eases.
For UK east coast surfers, the ideal scenario is a northerly swell followed by a west or southwest wind shift. The swell stays in the water while the local wind cleans up the surface.
Easterly and northeasterly North Sea storms
Easterly and northeasterly setups are important for east-facing coasts, particularly in England and Scotland. These storms develop when high pressure sits over Scandinavia and lower pressure lies to the south or southwest. The pressure gradient drives cold air westward across the North Sea.
These patterns can be persistent. A moderate easterly blowing for two or three days may produce better surf than a stronger wind lasting only a few hours.
Typical surf from an easterly setup:
- Swell direction: E to NE.
- Open-water wave height: 1 to 3 metres, larger in severe events.
- Surf height: knee-high to overhead.
- Peak period: 5 to 9 seconds.
- Quality: often choppy while the wind blows, but can become excellent during a lull.
These swells tend to be shorter-period than northerly swells because the fetch is usually more limited. However, they can be very surfable when the wind direction aligns with the beach exposure.
Westerly and northwesterly North Sea storms
Westerly storms are common when deep Atlantic lows pass north of Scotland and track toward Norway. These systems drive strong west, southwest, or northwest winds across the North Sea. They’re less useful for many UK east coast breaks because the wind blows offshore and swell travels away from shore. For Denmark, the Netherlands, Belgium, and parts of Norway, however, these are the primary swell drivers.
On a weather map, this pattern typically shows a deep low near Iceland, Scotland, or the Norwegian Sea, with higher pressure over the Atlantic or western Europe. The isobars stretch roughly west to east across the basin.
Typical surf from a westerly storm:
- Swell direction: W to NW, sometimes SW.
- Open-water wave height: 2 to 6 metres in winter gales.
- Surf height: chest-high to double overhead at exposed beaches.
- Peak period: 6 to 11 seconds.
- Quality: often wind-affected on west-facing beaches, cleaner when wind turns east or southeast.
For Denmark’s west coast, this is the dominant swell source. For the Dutch coast, northwest flow behind a cold front can produce some of the more organized surf available there.
Secondary lows over the North Sea
A secondary low is a smaller depression that forms along a front or near the main storm. These lows can develop quickly over the North Sea, the English Channel, or nearby land areas. They’re harder to forecast but can generate strong local surf.
On a weather map, a secondary low appears as a smaller bullseye of closed isobars. Wind direction changes rapidly around it, and one coast may receive strong onshore wind while another coast, only a few hundred kilometres away, gets offshore wind and new swell.
Typical surf from a secondary low:
- Swell direction: highly variable.
- Open-water wave height: 1 to 4 metres.
- Peak period: 5 to 9 seconds.
- Quality: changeable, with short windows of clean surf possible.
Polar lows and cold-air outbreaks
Polar lows are compact, intense systems that form over cold northern waters. They’re more relevant to the northern North Sea and Norwegian Sea than the southern basin, but when they send northerly or northwesterly wind into the North Sea they can create sudden pulses of steep swell.
Cold-air outbreaks also play a role. When very cold air moves over relatively warmer seawater, the lower atmosphere becomes unstable. That instability helps stronger winds mix down to the sea surface, which can accelerate wave growth significantly.
Typical North Sea swell directions by coastline
Because the North Sea is enclosed by multiple countries, there’s no single “best” swell direction. A perfect swell for one coast may produce offshore winds for another.
| Coastline | Most useful swell directions | Common quality pattern |
|---|---|---|
| UK east coast | N, NE and E | Best when swell remains after wind turns W or SW. |
| East Scotland | N, NE and E | Handles longer-period northern swell better than many southern beaches. |
| Denmark west coast | W, NW and SW | Often powerful but wind-exposed; cleaner with easterly wind. |
| Netherlands and Belgium | W, NW and N | Short-period surf is common; clean windows occur after frontal wind shifts. |
| North Sea-facing Norway | W, SW and NW | Stormy in winter, with better shape at sheltered points and reefs. |
Seasonal North Sea surf patterns
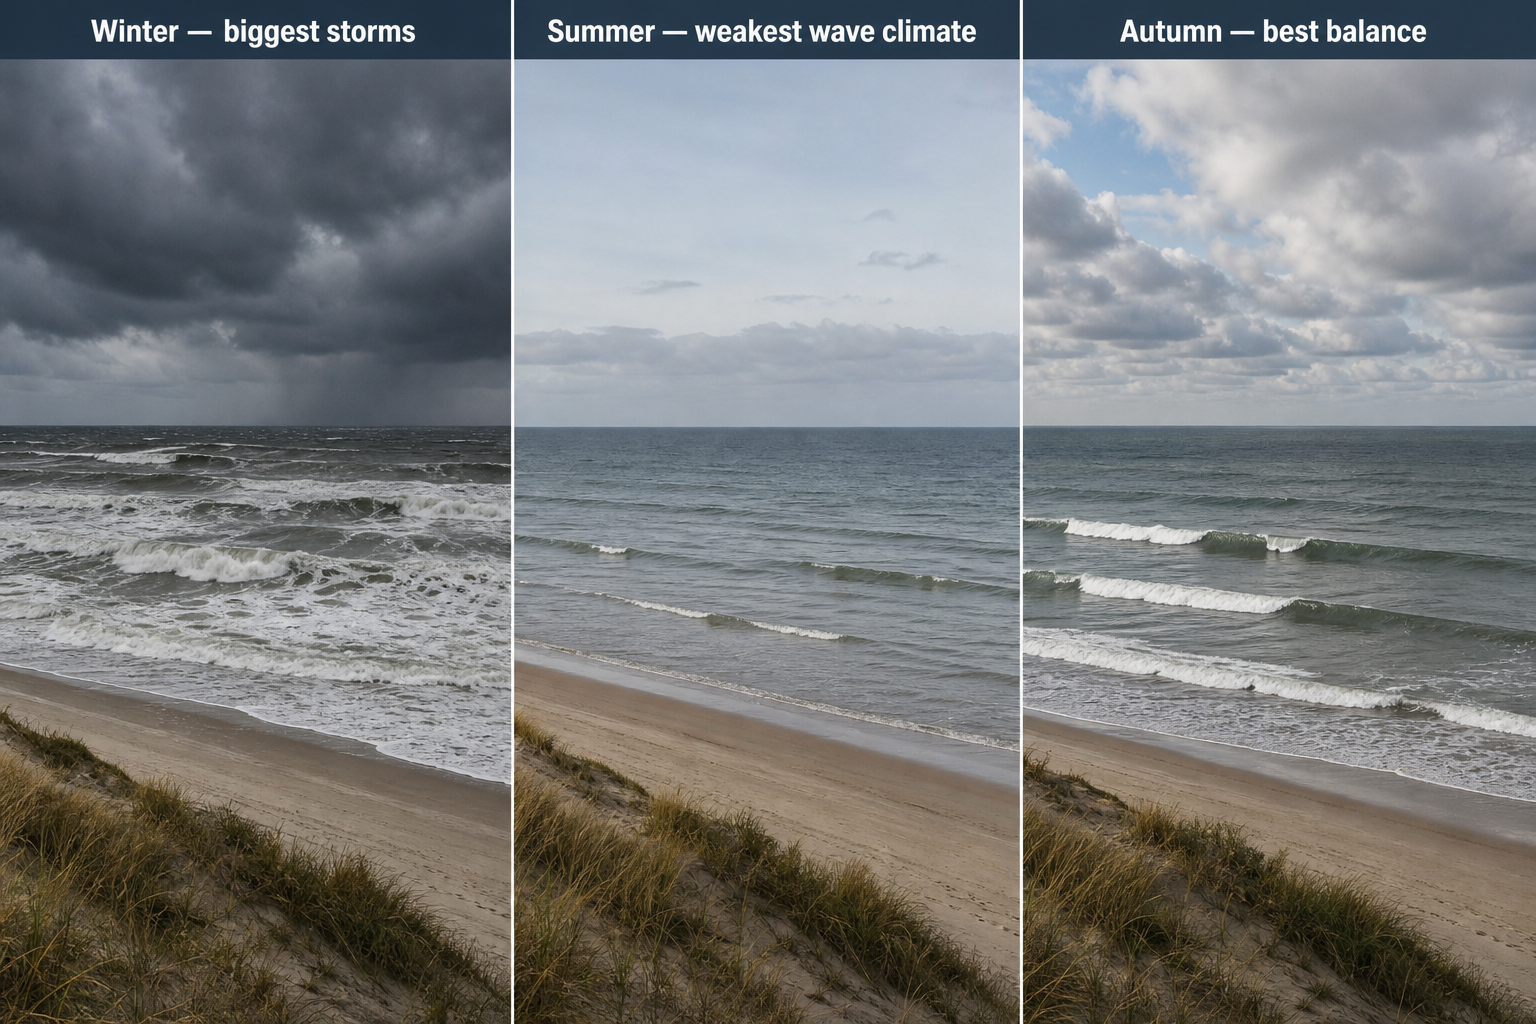
The North Sea has a strong seasonal rhythm. Winter produces the biggest storms, summer has the weakest wave climate, and autumn often delivers the best balance between swell frequency and surfable weather.
Winter North Sea waves
Winter is the stormiest season. Deep Atlantic lows track across the northern Atlantic, pass near Scotland, and move toward Scandinavia. Central pressures can fall below 980 hectopascals during major storms. However, the pressure gradient matters more than central pressure alone — a tightly wound moderate low can produce stronger surf than a sprawling deep one.
Typical winter conditions:
- Main storm types: deep Atlantic lows, northerly outbreaks and secondary lows.
- Swell directions: N to NE for the UK east coast; W to NW for Denmark and the Dutch coast.
- Open-water wave height: often 2 to 6 metres during storms.
- Peak period: commonly 7 to 11 seconds, occasionally longer in the north.
- Quality: powerful but often windy; best after the storm center moves away.
Winter water and air temperatures are low. Southern North Sea water runs around 5 to 8°C, while northern areas can be colder still. Cold air over the sea creates squally showers and gusty wind, which causes surf conditions to change quickly. Staying on top of real-time conditions is much easier with a handheld VHF marine radio with weather alerts or a dedicated NOAA emergency weather alert radio for monitoring incoming systems.
Spring North Sea waves
Spring is a transition season. The Atlantic storm track weakens, but northerly and easterly patterns remain possible. High pressure over Scandinavia can sustain long-lasting easterly flows, particularly in early spring.
Typical spring conditions:
- Main storm types: easterly gradients, northerly lows and smaller secondary systems.
- Swell directions: NE and E are most common for east-facing coasts.
- Open-water wave height: 1 to 3 metres in good events.
- Peak period: usually 6 to 9 seconds.
- Quality: can be clean when high pressure reduces local wind.
One spring forecasting detail worth noting is atmospheric stability. When warm air moves over cold water, surface winds may be weaker than forecast because the marine layer stabilizes. This can reduce wave growth, especially near the coast.
Summer North Sea waves
Summer is the least consistent season. Pressure gradients are weaker, storms are infrequent, and most swells come from short-lived local winds. Small surf can still arrive from northerly bursts, thermal lows, or passing fronts, but it’s rarely reliable.
Typical summer conditions:
- Main storm types: weak frontal lows, local wind events and occasional northerly flow.
- Swell directions: variable, often controlled by local wind.
- Open-water wave height: 0.5 to 1.5 metres, larger in rare gales.
- Peak period: commonly 4 to 7 seconds.
- Quality: small and tide-sensitive, but clean during light offshore winds.
Summer waves arrive and disappear quickly. Buoy readings and short-range wind forecasts are more useful than long-range swell charts during this season. A handheld anemometer at the beach lets you check wind speed and direction on the spot, which can make the difference between a wasted trip and a clean session.
Autumn North Sea waves
Autumn is often the most rewarding surf season in the North Sea. The sea is still relatively warm from summer, while Atlantic lows become stronger and more frequent. Growing temperature contrasts help storms deepen, making the wave climate noticeably more active than summer while still offering cleaner windows than mid-winter.
Typical autumn conditions:
- Main storm types: Atlantic lows, northwest gales and early northerly outbreaks.
- Swell directions: N, NE, W and NW depending on coast.
- Open-water wave height: 1.5 to 5 metres in strong storms.
- Peak period: usually 6 to 11 seconds.
- Quality: often better than winter because clean windows are more frequent.
Autumn also produces strong post-frontal setups. A cold front passes, wind swings offshore, the swell holds, and the surf improves for a few hours before fading. Knowing these sequences is one of the most useful skills a North Sea surfer can develop.
What North Sea surf storms look like on a weather map
Reading a weather map is one of the best ways to anticipate surf. Wave models are helpful, but the pressure chart explains why the model is showing swell in the first place. If you want to build this skill from the ground up, this oceanography textbook covers wave generation and atmospheric dynamics in accessible detail.
Low pressure and tight isobars
Look for an “L” surrounded by closed isobars. The closer the isobars, the stronger the wind. A deep low with widely spaced isobars may not create much surf near your coastline, while a modest low with very tight isobars positioned directly over the North Sea can produce excellent waves.
In the Northern Hemisphere, wind flows anticlockwise around low pressure and clockwise around high pressure. Over the sea, wind crosses the isobars slightly toward lower pressure. This means you can estimate wind direction just by examining the pressure pattern, before even looking at a wind model.
The northerly North Sea map pattern
For a northerly swell, look for low pressure to the east or northeast and high pressure to the west. The isobars should run down the length of the North Sea. If they align from northern Scotland toward the Netherlands, the fetch is lined up with the basin and waves can grow quickly.
The easterly North Sea map pattern
For an easterly swell, look for high pressure over Scandinavia and lower pressure over western or southern Europe. The map may show a broad easterly flow across the southern North Sea. If this pattern holds for more than a day, surf can build meaningfully even without a dramatic storm center nearby.
The westerly North Sea map pattern
For westerly or northwesterly swell, look for a low passing north of Scotland or into the Norwegian Sea. The strongest winds often occur behind the cold front. This pattern is particularly important for Denmark, the Netherlands, and North Sea-facing parts of Norway.
How to forecast North Sea waves from storms
Forecasting North Sea surf is partly about reading charts and partly about understanding local exposure. Because the sea is small compared with the Atlantic, small changes in storm position can make a large difference to the surf.
Step 1: Know your coastline’s swell window
Start with the direction your beach faces. An east-facing beach needs energy from the east or northeast. A west-facing beach in Denmark needs west or northwest swell. If wind is blowing hard but the fetch points away from your coast, the local forecast may still be flat.
Step 2: Find the fetch on the weather map
Trace the area where strong wind is blowing over open water. Ask four questions:
- Is the wind direction aimed at the coast?
- Is the fetch long enough to build waves?
- Will the wind last at least 6 to 12 hours?
- Is the strongest wind over sea rather than land?
A 30-knot wind over 500 kilometres of open water is far more valuable than a 40-knot gust over a short coastal strip.
Step 3: Check wave height, period and direction
Wave models typically show significant wave height, peak period, and swell direction. Significant wave height is the average height of the highest one-third of waves in open water. Individual waves can be larger, while breaking surf height depends on the seabed shape and tide. It’s worth keeping a marine barometer handy so you can track pressure changes at your location alongside the model data.
For North Sea surf, a forecast of 1 metre at 7 seconds can be rideable at a well-exposed beach. A forecast of 2 metres at 9 seconds is a solid event. A forecast of 3 metres or more at 10 seconds can be powerful, especially where the beach faces the swell directly.
Step 4: Estimate swell arrival time
North Sea swells don’t travel for days the way ocean groundswells do. They often arrive while the wind is still blowing, or within several hours of the strongest fetch. As a rough guide, deep-water wave energy travels at about 0.78 times the wave period in metres per second. A 10-second swell travels around 28 kilometres per hour, while a 7-second swell travels around 20 kilometres per hour.
If the generating fetch is 400 kilometres away, the first useful energy from an 8-second swell may arrive within roughly 20 hours. Local wind swell can reach shore even sooner.
Step 5: Look for the clean-up window
North Sea waves are often best after the main wind event, not during it. The ideal sequence is straightforward: strong wind builds swell, the wind shifts offshore, and the swell holds long enough to surf before fading.
Post-frontal wind shifts are especially valuable. A northerly gale may create swell for the UK east coast, but if the low moves away and the wind turns west or southwest, that same swell can become noticeably cleaner. Keeping detailed notes on these sequences over time sharpens your forecasting considerably. A surf log book is ideal for this, or a waterproof field notebook if you want something that survives a wet car park.
Step 6: Use buoys and coastal observations
Buoys are invaluable because they show what is actually happening rather than what a model predicts. Watch the trend in wave height, period, and direction. If an upwave buoy rises from 1 metre at 6 seconds to 2 metres at 9 seconds, the storm is producing more organized energy.
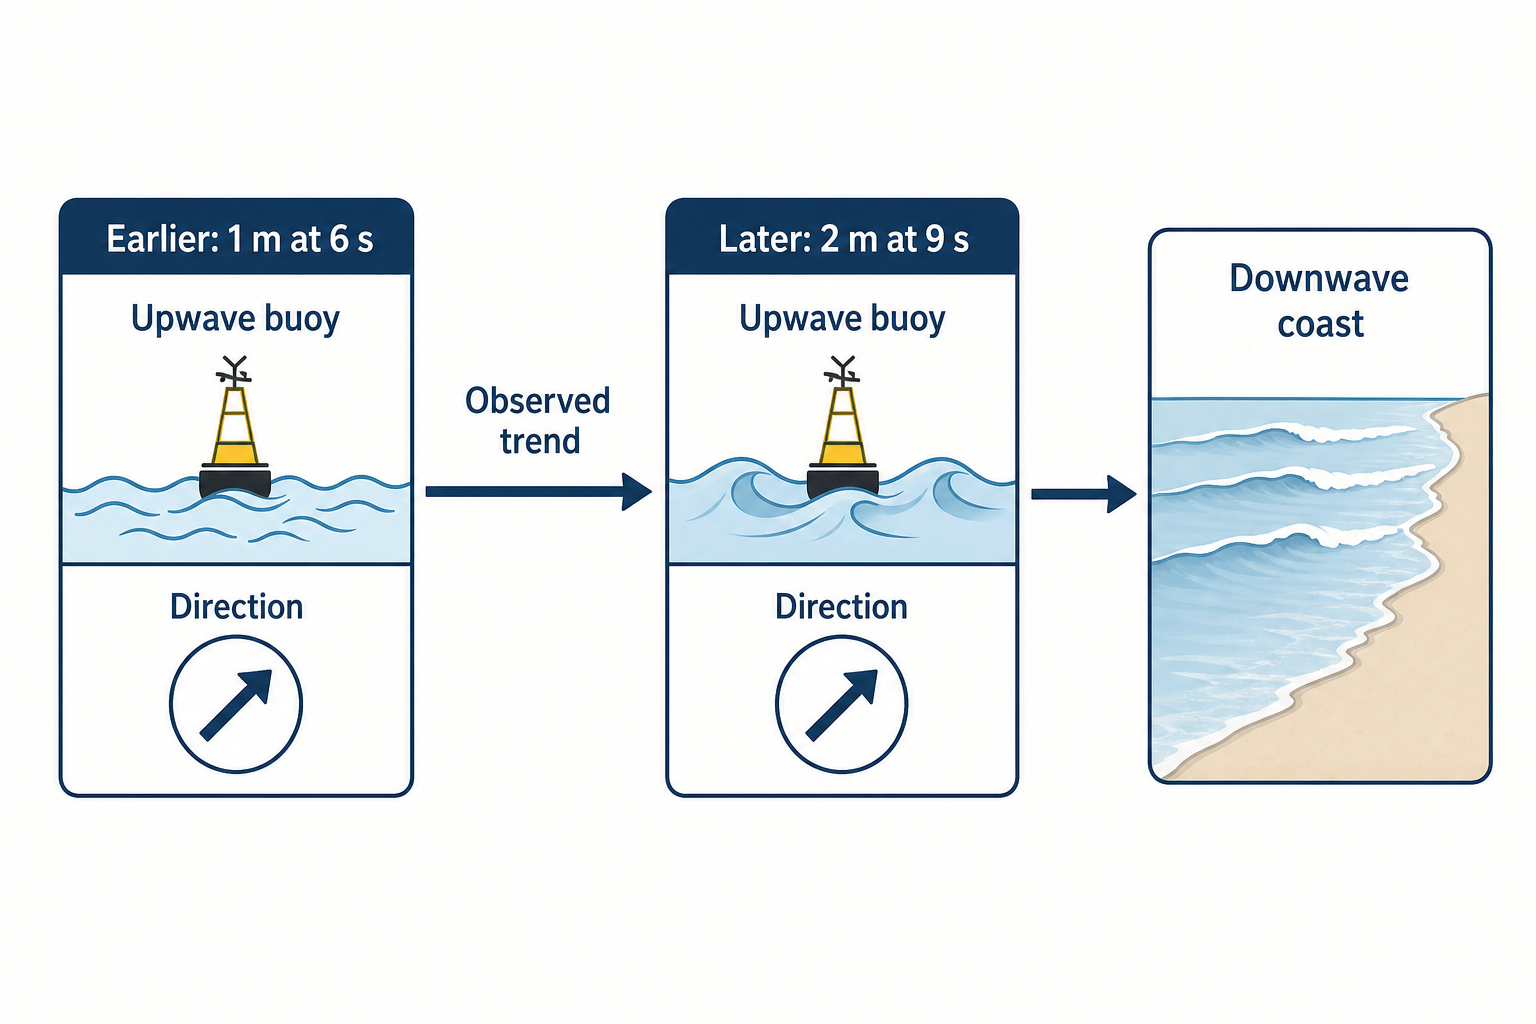
In the North Sea, timing is critical because swell windows can be short. A rising buoy means the best surf may still be ahead. A falling buoy may mean the swell is already fading, even if the forecast still looks promising on paper. For situations where you need to keep printed chart information dry and legible, a waterproof map case keeps forecast printouts and tide tables usable in the field.
Step 7: Adjust for tide and local bathymetry
The same forecast can produce very different surf at different tidal stages. Some North Sea beaches need a lower tide to expose sandbars. Others work better with more water over the banks. Tidal current direction can also change wave shape within a single hour.
This is where local knowledge becomes essential. A regional forecast tells you whether there will be swell. The tide and the sandbars decide whether that swell becomes good surf.
Why North Sea wave quality changes so quickly
North Sea surf is highly changeable because storms are close, fetches are limited, and the basin is shallow. A small wind shift can turn clean lines into chop within an hour. A falling tide can transform weak waves into steep, punchy peaks. A storm tracking 100 kilometres farther east than forecast can shift the swell direction enough to miss a coastline entirely.
The best forecasts combine three layers of information: the weather map, the wave model, and real-time observations. The weather map shows the cause, the model predicts the result, and buoy and beach reports confirm what’s actually happening on the water.
North Sea waves may not have the long-period perfection of open-ocean groundswell, but they reward surfers who take the time to understand storm structure and timing. When a low lines up with the basin, the pressure gradient tightens, and the local wind finally swings the right way, the North Sea can deliver surprisingly powerful and satisfying surf. Learning to read those patterns consistently — through weather maps, buoy data, and accumulated local knowledge — turns one of Europe’s most challenging forecast regions into one of its most rewarding places to chase waves.