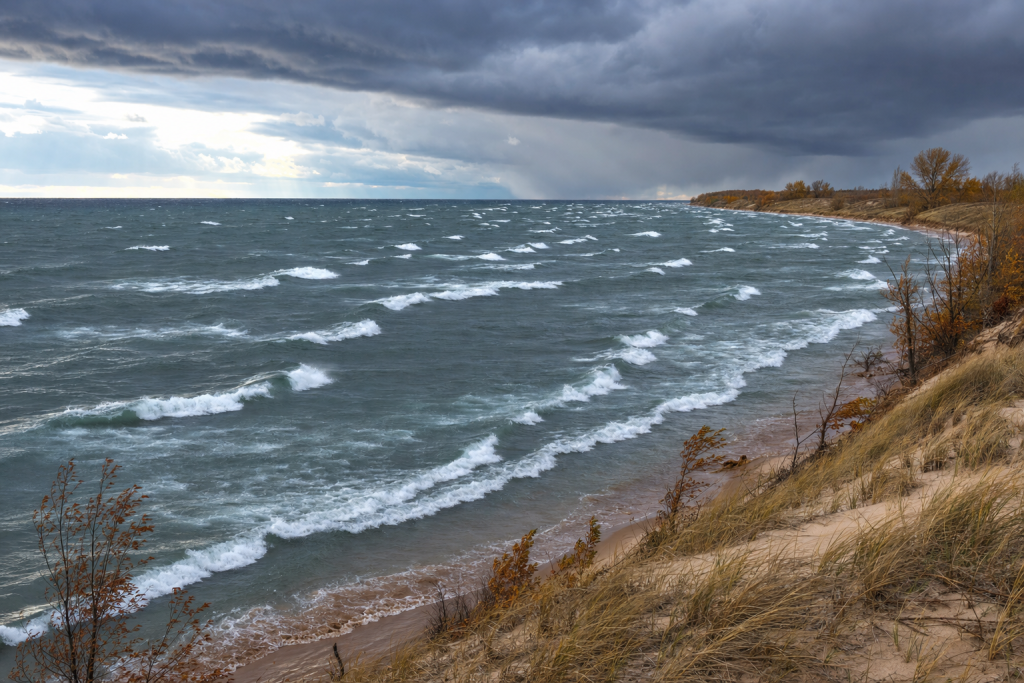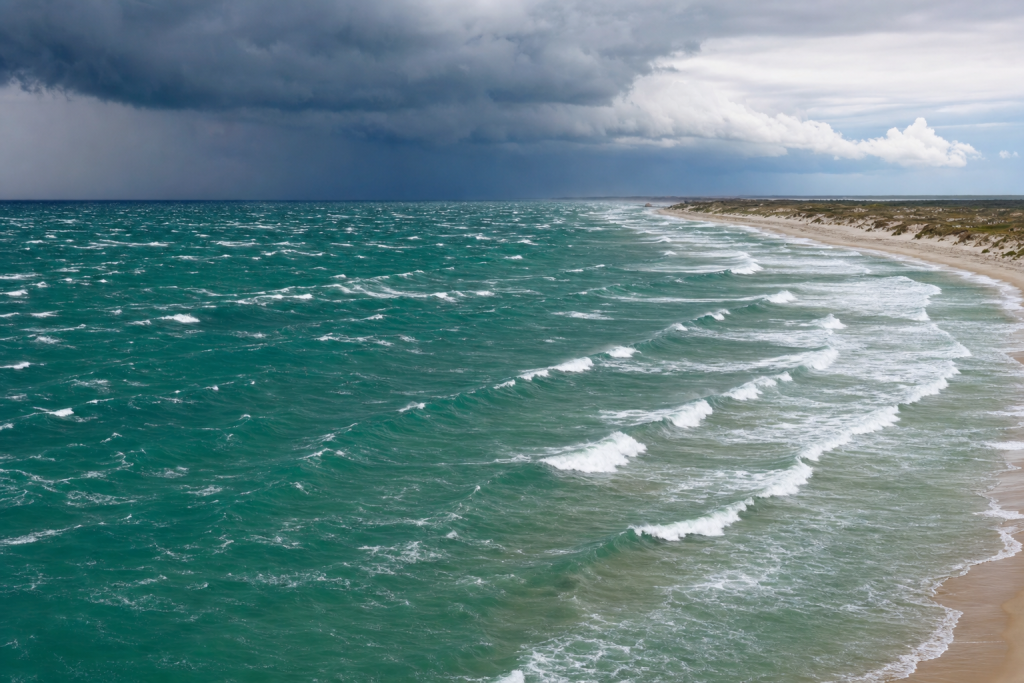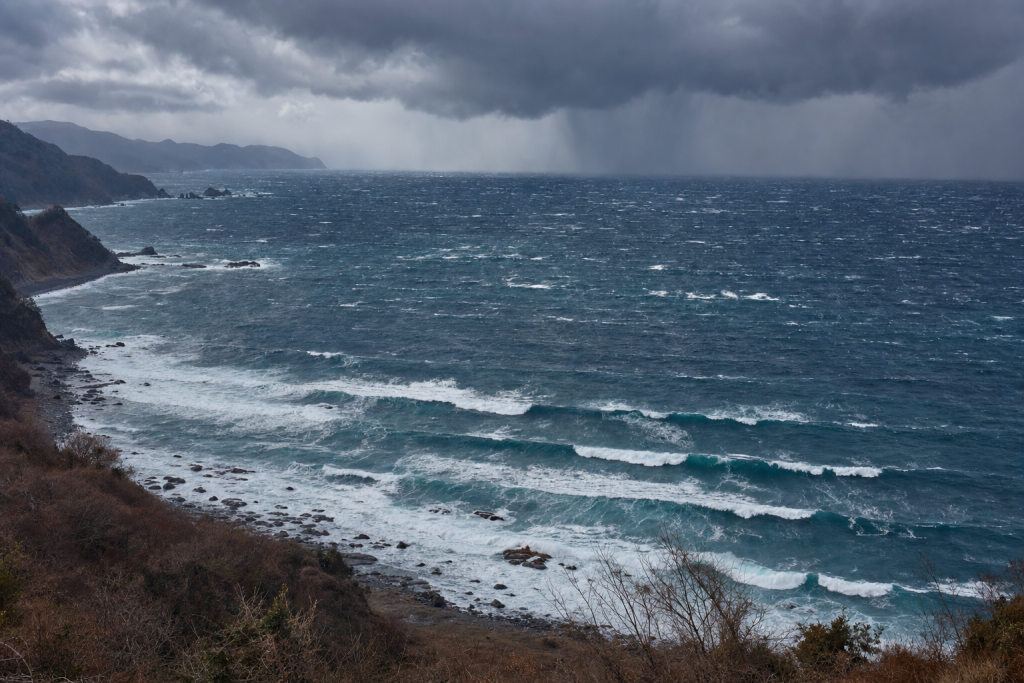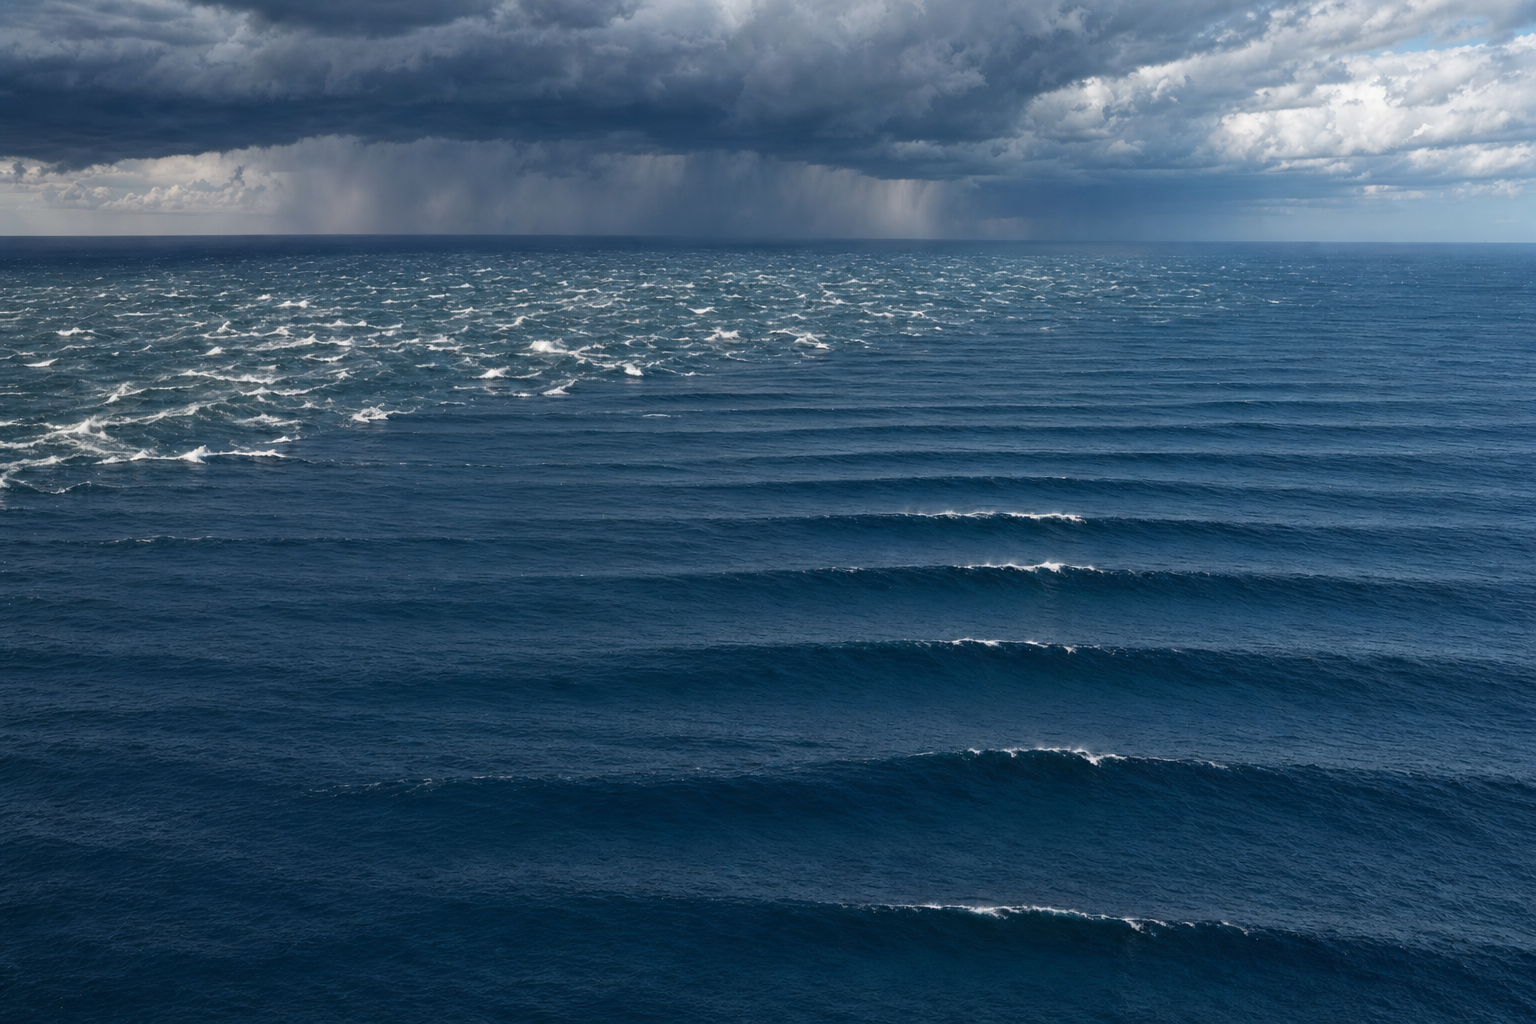
The South Pacific is one of the world’s great swell engines. A storm thousands of miles south of New Zealand can send long-period lines to Tahiti, Hawaii, California, and the west coast of South America days later. To understand those waves, you need to understand the weather systems that build them: deep low-pressure storms, strong pressure gradients, long fetches, and the vast open-water tracks that let swell travel without interruption. If you want to go deeper on the science behind all of this, this surf forecasting guide covers everything from storm systems to swell reading in plain language. For the oceanographic side of things, this oceanography textbook provides solid background on how ocean energy moves across basins.
How South Pacific Swell Generation Works
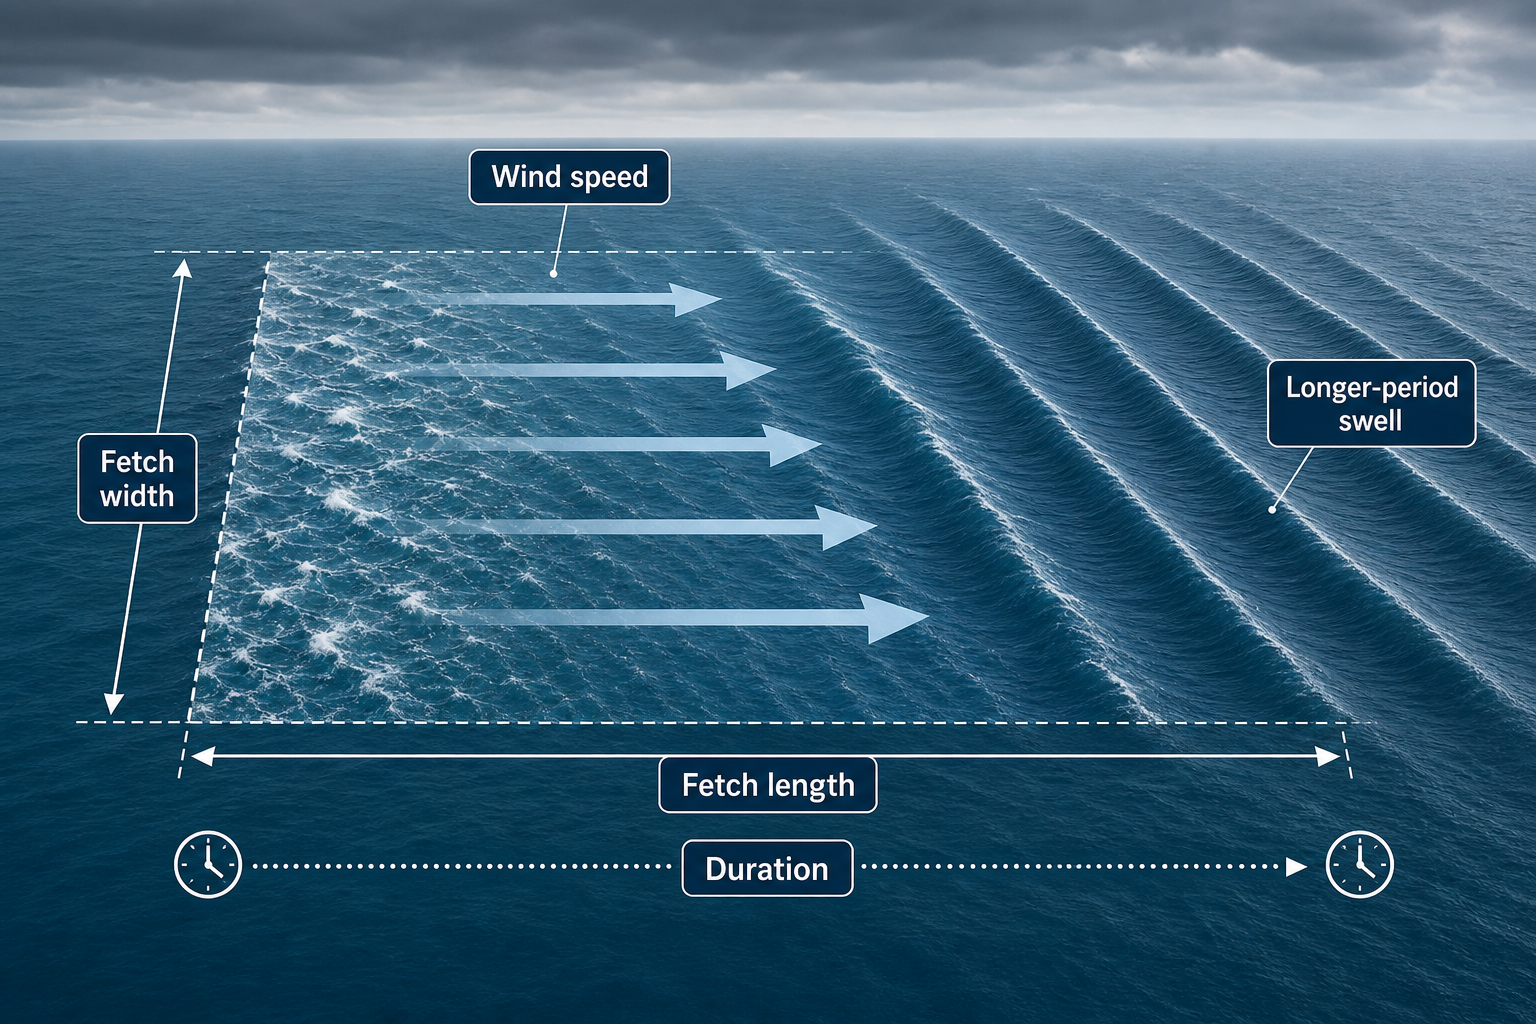
A surfable swell begins when wind transfers energy into the ocean. The stronger the wind, the longer it blows, and the farther it travels over open water, the bigger and more organized the resulting swell becomes. In forecasting, the three core ingredients are wind speed, fetch, and duration.
Wind Speed, Fetch, and Duration
Wind speed determines how much energy is available. Gale-force winds of 34 to 47 knots can produce solid surf. Storm-force winds of 48 to 63 knots create larger, longer-period swell. Hurricane-force winds above 64 knots can generate exceptional surf when they cover enough ocean.
Fetch is the length and width of ocean over which wind blows in roughly the same direction. A small, compact low can create short-lived swell, but a broad fetch stretching hundreds of nautical miles can build powerful long-period groundswell. Duration matters because the sea surface needs time to respond. A storm that blows hard for six hours may create choppy wind swell, while a storm that sustains itself for two days can generate a well-spaced groundswell capable of crossing the entire Pacific.
Wave Period and Why South Pacific Swells Travel So Far
Wave period is the time between wave crests. Short-period swell, typically 8 to 11 seconds, feels weaker and more locally generated. Medium-period swell around 12 to 15 seconds can be very useful at exposed coasts. Long-period swell from 16 to 22 seconds or more is the classic South Pacific groundswell that wraps into reefs, bends around points, and shows long, clean lines on the horizon.
Long-period waves travel faster than short-period waves. In deep water, swell group speed in knots is roughly 1.5 times the period in seconds. An 18-second swell travels at about 27 knots, covering roughly 650 nautical miles per day. That is why a major storm near the Southern Ocean can reach Hawaii in about a week and California several days after that, depending on the source region. If you want to track these patterns more closely, keeping a surf journal to log swell arrival times and conditions is a great way to build your own forecasting intuition over time.
Why the South Pacific Is Such a Powerful Swell Source
The South Pacific connects directly with the Southern Ocean, where the “Roaring Forties” and “Furious Fifties” describe the powerful westerly wind belts between roughly 40 and 60 degrees south latitude. These latitudes have almost no land barriers, allowing storms to build enormous fetches across open water.
The engine driving these storms is a sharp temperature contrast. Cold Antarctic air pushes northward over cold Southern Ocean water, while warmer subtropical air sits farther north. In Southern Hemisphere autumn and winter, this contrast sharpens significantly. The jet stream strengthens, low-pressure systems deepen, and frontal boundaries become more active and frequent.
Typical sea-surface temperatures near the storm belt range from near freezing close to Antarctica to around 10 degrees Celsius farther north. Subtropical waters north of the storm track can reach 15 to 25 degrees Celsius. The greater the temperature contrast between air masses, the more energy is available for storm development. A home weather station that tracks barometric pressure can help you spot incoming weather changes that often signal a new swell on the way.
South Pacific Storm Types That Create Surf
Deep Southern Ocean Lows
The classic South Pacific swell producer is a deep low-pressure system tracking eastward under New Zealand or across the central South Pacific. These storms often bottom out between 960 and 990 hectopascals, while stronger systems can drop below 950 hectopascals. When a strong high-pressure system sits to the north, typically around 1025 to 1035 hectopascals, the pressure gradient tightens and winds accelerate dramatically.
These storms produce long-period SSW, S, and SW swell depending on their position and wind alignment. They are the primary source of winter surf for Tahiti, Hawaii’s south shores, California, Mexico, Central America, and the west coast of South America. Periods commonly run 15 to 20 seconds, with exceptional storms generating 21 to 24 seconds. A marine barometer is a useful tool for tracking the pressure drops that often signal the approach of one of these systems.
New Zealand and Southwest Pacific Lows
Lows near the Tasman Sea, south of New Zealand, or east of New Zealand can aim swell toward the South Pacific islands and Hawaii. If the fetch is angled northeast, it can send organized SSW swell toward Tahiti and Hawaii. If it is oriented more eastward, the swell may favor Chile and Peru instead.
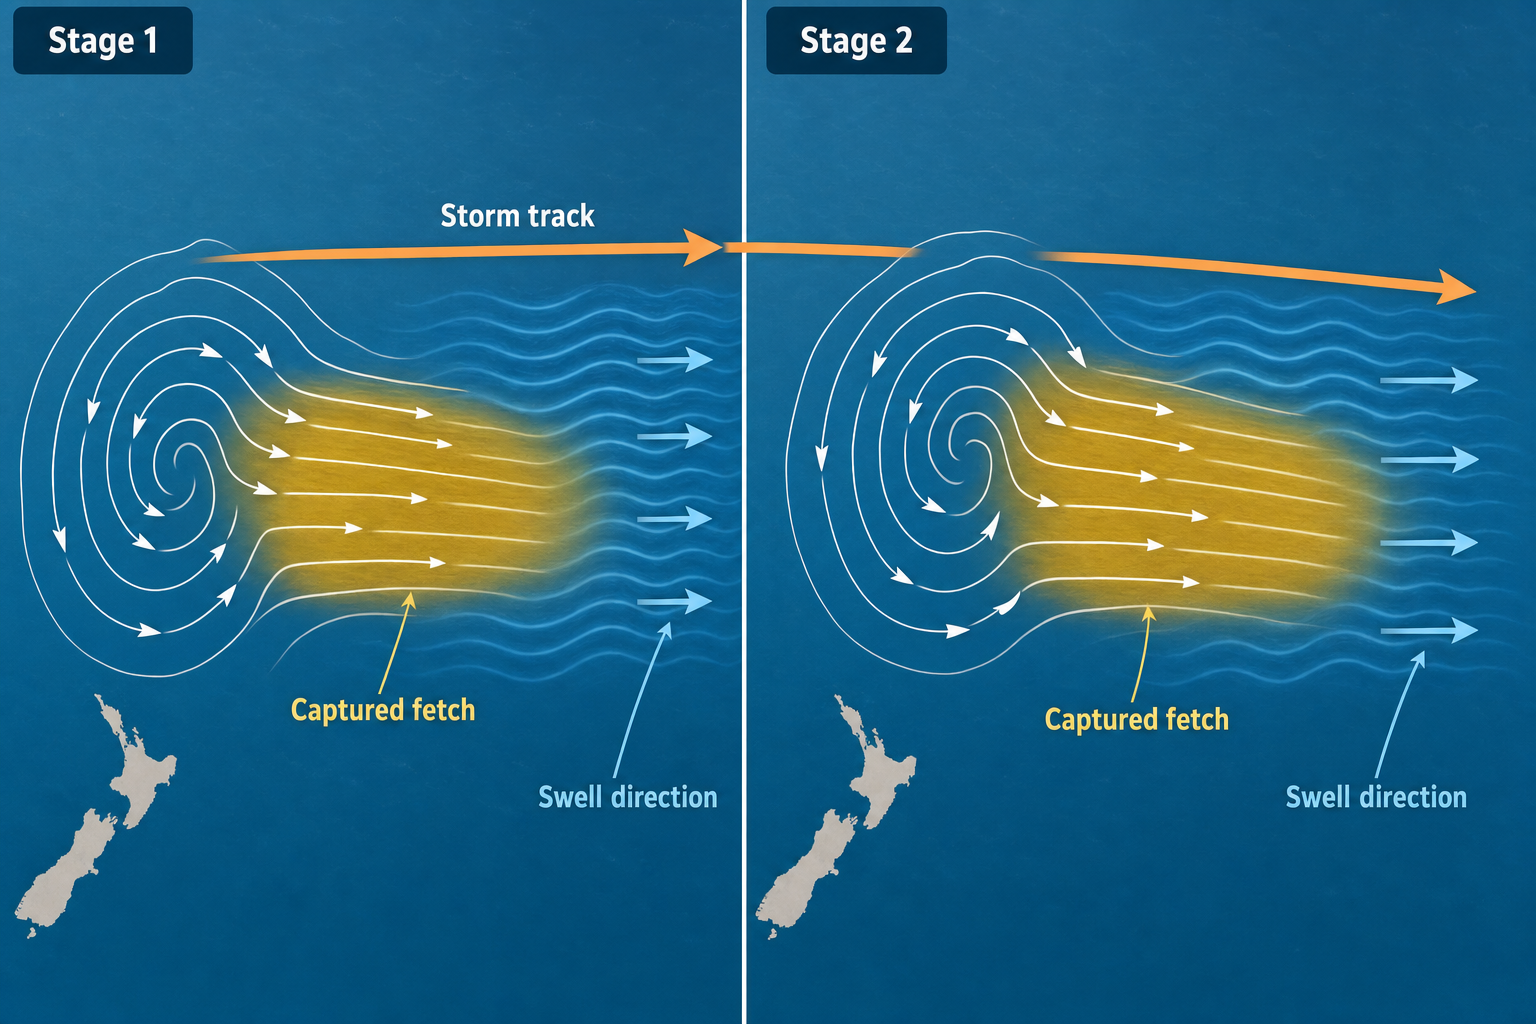
Storms in this region matter because they sit along a useful great-circle path for many high-quality reef and point breaks. A slow-moving low with a captured fetch — where the storm moves in the same direction as the swell it is generating — is especially powerful and can sustain energy delivery to a coastline for multiple days.
Southeast Pacific Lows
Storms in the southeast Pacific, west or southwest of Chile, sit closer to South America. They can produce large, consistent SW to SSW swell for Chile, Peru, Ecuador, and Colombia. Because the travel distance is shorter for these coasts, the swell may arrive with more size and less decay than it would farther north or west.
These systems can also send long-period energy toward Mexico and California if the fetch is broad enough and aimed north. However, direction becomes critical. A swell that tracks too steeply south may miss certain breaks or get blocked by coastal orientation and offshore islands.
Tasman Sea and Subtropical Lows
The Tasman Sea sits between Australia and New Zealand and, while it is not the open South Pacific storm belt, it is closely connected to South Pacific swell generation. Tasman lows can send S, SE, and ESE swell into eastern Australia, New Zealand, and nearby islands. Subtropical lows farther north can also generate useful surf, usually in the shorter to medium-period range of 9 to 15 seconds. These systems are especially important for Queensland, New South Wales, Fiji, and Tonga.
Tropical Cyclones in the South Pacific
South Pacific tropical cyclones are most common from November through April. They form over warm tropical water, typically above 26 degrees Celsius. Unlike large Southern Ocean storms, cyclones are compact, intense, and highly directional. A slow-moving cyclone over open water can generate excellent swell, often with periods of 10 to 16 seconds. The best results happen when the cyclone stays far enough offshore for the swell to organize before reaching the coast. These swells can be exceptional for Fiji, Samoa, Tonga, New Zealand’s east coast, eastern Australia, and parts of French Polynesia. A handheld VHF marine radio with NOAA weather alerts is worth having on hand during cyclone season, especially if you are surfing in a remote location.
Seasonal South Pacific Swell Patterns
| Season | Main Storm Pattern | Typical Periods | Typical Directions | Wave Quality |
|---|---|---|---|---|
| December to February | Fewer deep Southern Ocean lows; more tropical cyclones and subtropical lows | 8 to 16 seconds | E, SE, S, and variable cyclone swell | More regional and less consistent; excellent when cyclones track well |
| March to May | Southern Ocean begins to strengthen; cyclone remnants can merge with fronts | 12 to 20 seconds | S, SSW, and SW | Often clean, powerful, and less crowded in some zones |
| June to August | Peak winter storm belt with deep lows and strong pressure gradients | 15 to 22+ seconds | S, SSW, and SW | Most consistent season for long-period groundswell |
| September to November | Storm track remains active but gradually weakens | 12 to 20 seconds | S, SW, and mixed subtropical swell | Still strong for the Americas, Tahiti, and New Zealand |
What South Pacific Surf Storms Look Like on a Weather Map
On a surface weather map, a strong South Pacific swell producer typically appears as a deep low-pressure center surrounded by tightly packed isobars. In the Southern Hemisphere, winds circulate clockwise around low pressure. The best surf-producing fetch is the section of the wind field pointing toward the target coast. Understanding how to read these maps takes some practice, and a reference like this weather terminology guide can help decode the terminology used in marine forecasts. For reading the charts themselves, this nautical chart guide is a thorough reference for understanding how weather and ocean data are presented spatially.
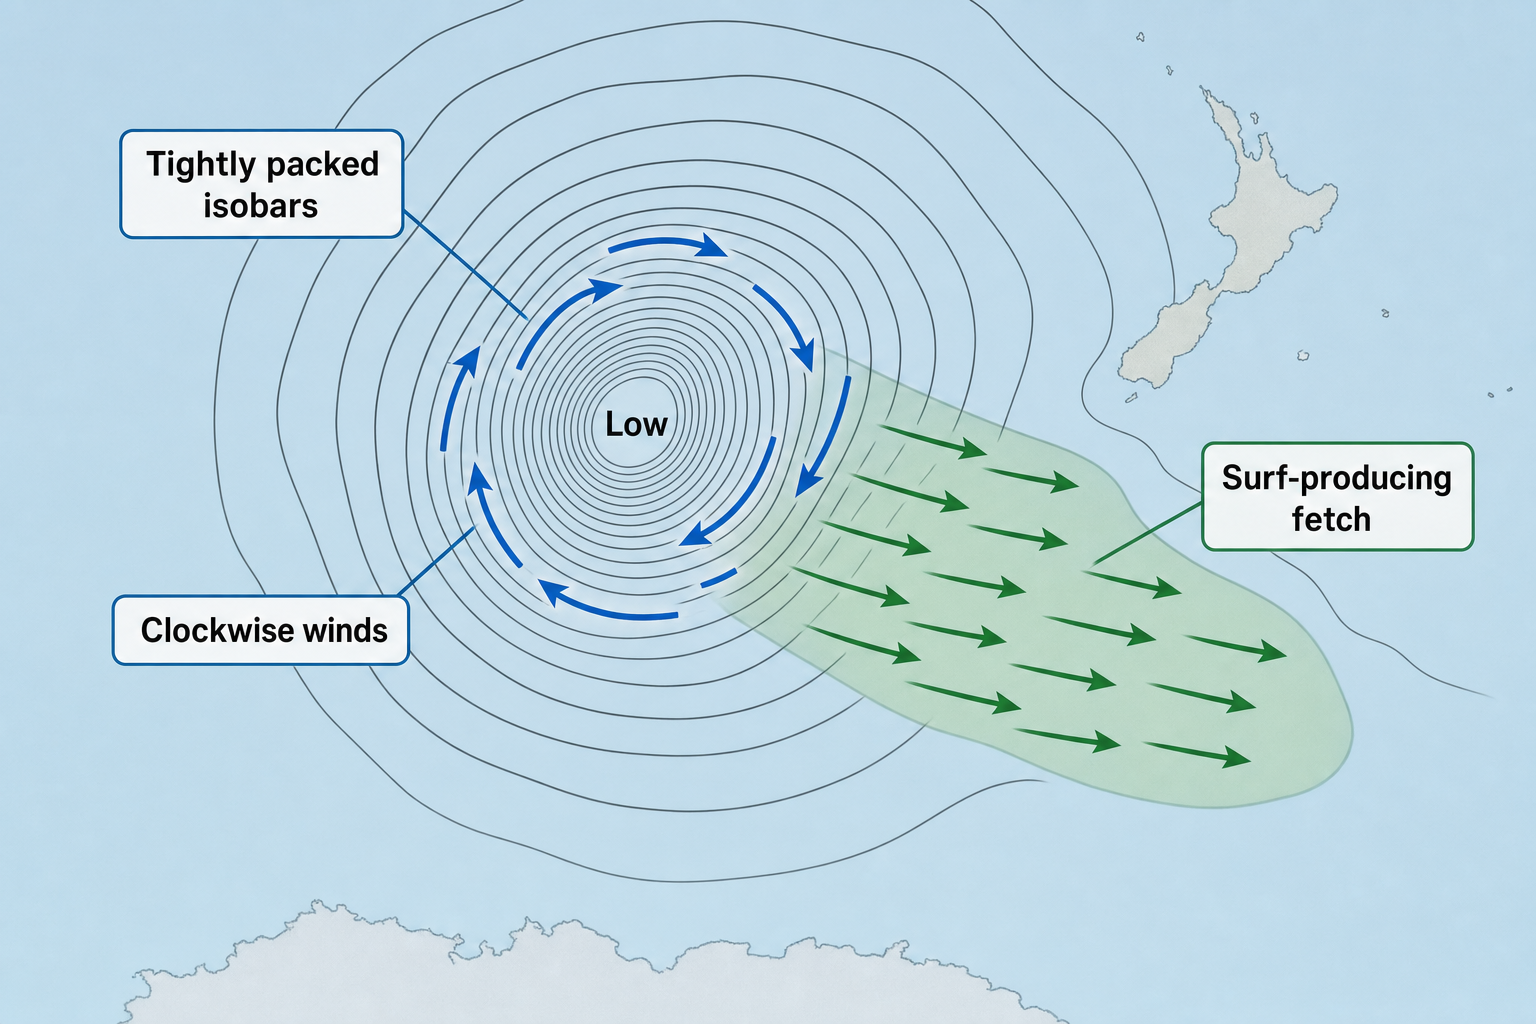
Look for these features when scanning weather maps:
- A deep low: Strong storms often show central pressure below 980 hectopascals. Extreme systems may fall below 950 hectopascals.
- Tight isobars: The closer together the isobars, the stronger the wind. A strong high to the north can dramatically increase the pressure gradient and wind speed.
- A broad, aligned fetch: Wind arrows should point along the great-circle path toward the surf zone for maximum swell delivery.
- Slow or favorable storm movement: A storm moving in the same direction as its swell can create a captured fetch and extend energy delivery.
- Open-water exposure: Land, sea ice, and island chains can block or significantly reduce incoming swell.
On satellite imagery, these storms typically show a comma-shaped cloud mass wrapping around the low center. Cold fronts trail north and west from the system, while bands of post-frontal southwest wind spread across the ocean behind the front. Keeping a waterproof field notebook handy lets you jot down observations and swell notes wherever you are, even at the beach.
How South Pacific Swell Direction Controls the Surf
Swell direction is measured from where the swell originates. A 200-degree swell is coming from the SSW. A 180-degree swell is straight south. Direction determines which coasts receive the energy and which breaks are shadowed or protected. If you want to follow storm tracks across the Pacific basin, a world atlas showing ocean geography helps visualize how swell travels from its source to distant coastlines.
South Pacific swell does not travel in straight lines on a flat map. It follows great-circle paths across the globe. This is why a storm south of New Zealand can send swell to Hawaii, while another storm positioned farther east may favor California, Mexico, or Peru instead. Long-period swell also refracts strongly as it reaches shallower water. It bends toward reefs, points, and submarine canyons, which can turn a moderate open-ocean swell into powerful surf at a focused reef while nearby beaches remain much smaller.
Regional South Pacific Swell Impacts
The heights below refer to approximate breaking wave face heights at exposed breaks. Local swell magnets can produce waves much larger, while sheltered beaches can be significantly smaller.
| Region | Best South Pacific Season | Common Directions and Periods | Typical Surf Impact and Quality |
|---|---|---|---|
| Hawaii | April to October, strongest May to September | SSE to SSW, about 160 to 220 degrees; 14 to 22 seconds | South shores receive 2 to 8 foot surf, with major events much larger. Long-period SSW swells can be powerful and well-lined. |
| California | May to October | S to SSW, about 170 to 220 degrees; 14 to 22 seconds | Southern California is the main beneficiary, with 2 to 6 foot surf common during strong pulses. Major long-period swells can produce 8 to 12 foot faces at standout spots. |
| Oregon | Late spring to early autumn | S to SW, about 180 to 220 degrees; 14 to 21 seconds | South Pacific swell is often small and selective here. Exposed reefs and beaches may see 1 to 4 foot lines, but local winds and dominant North Pacific patterns usually matter more. |
| Washington | Late spring to early autumn | S to SW, about 180 to 220 degrees; 14 to 21 seconds | Energy is typically filtered by distance and coastal angle. Rare exposed breaks can pick up small long-period pulses during strong events. |
| Mexico | April to October | S to SW, about 180 to 220 degrees; 14 to 22 seconds | Mainland Mexico is highly exposed. Good swells produce 4 to 10 foot surf, and major events can create much larger waves at points and beachbreaks. |
| Colombia | March to October | S to SW, about 180 to 220 degrees; 13 to 20 seconds | The Pacific coast receives consistent southern energy. Surf often runs 3 to 8 feet at exposed breaks during active periods. |
| Ecuador | March to October | S to SW, about 180 to 220 degrees; 14 to 21 seconds | Mainland Ecuador and the Galápagos can receive strong groundswell. Direction and island shadowing create large size differences between nearby breaks. |
| Peru | April to October, though swell is frequent year-round | S to SW, about 180 to 230 degrees; 14 to 22 seconds | Peru is one of the most consistent South Pacific swell receivers. Long left points can produce 4 to 12 foot surf for days, with much larger winter events. |
| Chile | April to October, strongest in winter | SW to SSW, about 190 to 240 degrees; 12 to 22 seconds | Chile sits close to the storm source and often sees large surf. Exposed zones regularly see 6 to 15 foot surf during winter, with major storms producing far bigger waves. |
| Tahiti | April to October | S to SW, about 180 to 220 degrees; 14 to 22 seconds | South-facing reefs receive powerful, focused groundswell. Quality can be exceptional when long-period SSW swell meets favorable local wind. |
| South Pacific Islands | April to October for groundswell; November to April for cyclones | S to SW groundswell; E to SE cyclone swell; 10 to 22 seconds | Fiji, Tonga, Samoa, the Cook Islands, and French Polynesia all respond strongly to swell direction. Reef exposure and island shadowing are critical factors. |
| Australia | Year-round, with winter Southern Ocean energy and summer cyclone swell | SE to S for the east coast; S to SW for southern coasts; 9 to 20 seconds | New South Wales benefits from Tasman lows and long-period S swell. Queensland relies more on Coral Sea systems, trade swell, and cyclones. |
| New Zealand | Year-round, strongest autumn through spring | SW for west coasts; E to SE for east coasts; S for south-facing coasts; 10 to 20 seconds | New Zealand sits close to multiple storm tracks. Surf can be large, consistent, and highly varied depending on which coast you are on. |
| Japan | Late spring to autumn for rare southern pulses | S to SE, about 130 to 180 degrees; 13 to 20 seconds | South Pacific swell is usually weak and heavily filtered by the time it reaches Japan. Typhoons are far more important, but exposed Pacific-facing coasts can occasionally pick up long-period southern lines. |
| Philippines | Occasional influence during Southern Hemisphere winter | SE to S, often filtered; 12 to 18 seconds | Most surf comes from western Pacific systems and monsoon patterns. South Pacific energy is limited by distance, island shadowing, and swell angle. |
| Other Parts of Asia | Highly regional | SE to S for exposed western Pacific zones; 10 to 18 seconds | Micronesia, Papua New Guinea, and eastern Indonesia can receive some South Pacific energy. Farther west, Indian Ocean and local storm systems dominate. |
How to Forecast Waves from South Pacific Storms
Start with the Swell Window
Every coastline has a limited swell window — the range of directions from which it can receive energy. Hawaii’s south shores need swell from roughly 160 to 220 degrees. Southern California usually favors 170 to 220 degrees. Peru and Chile are open to a broad southern and southwestern window. If the storm falls outside that window, even a powerful low-pressure system may not produce much surf at the target coast. A coastal navigation chart can help you visualize exposure angles and understand which breaks are open to which swell directions.
Check the Storm’s Wind Field
Do not focus only on central pressure. A very deep low with poor wind alignment can underperform expectations. A less dramatic storm with a broad, well-aimed fetch can deliver better surf than the numbers suggest. Examine wind speed, fetch width, and the direction of the strongest sustained winds relative to your target coast. A handheld anemometer is also useful for checking real-time local wind speed and direction when you arrive at the beach to assess surface conditions.
Estimate Period and Arrival Time
Storm-force winds sustained over a long fetch commonly generate 16 to 20 second swell. Extreme storms can produce longer periods still. To estimate arrival time, divide the distance in nautical miles by 1.5 times the swell period in seconds.
For example, an 18-second swell traveling 4,000 nautical miles moves at about 27 knots. That gives a travel time of roughly 148 hours, or just over six days. The first long-period forerunners typically arrive before the main energy, so surf often builds gradually over 12 to 24 hours before reaching peak size.
Watch for Swell Decay and Shadowing
Swell loses energy as it spreads across the ocean. It can also be blocked by New Zealand, French Polynesia, the Line Islands, the Galápagos, or nearshore islands. Directional shadowing is one of the most common reasons a buoy shows solid swell while a nearby beach stays small. Understanding your local geography is just as important as reading the storm itself. A waterproof map case is handy for keeping printed charts usable in wet conditions when you are scouting new breaks.
Use Buoys and Spectral Data
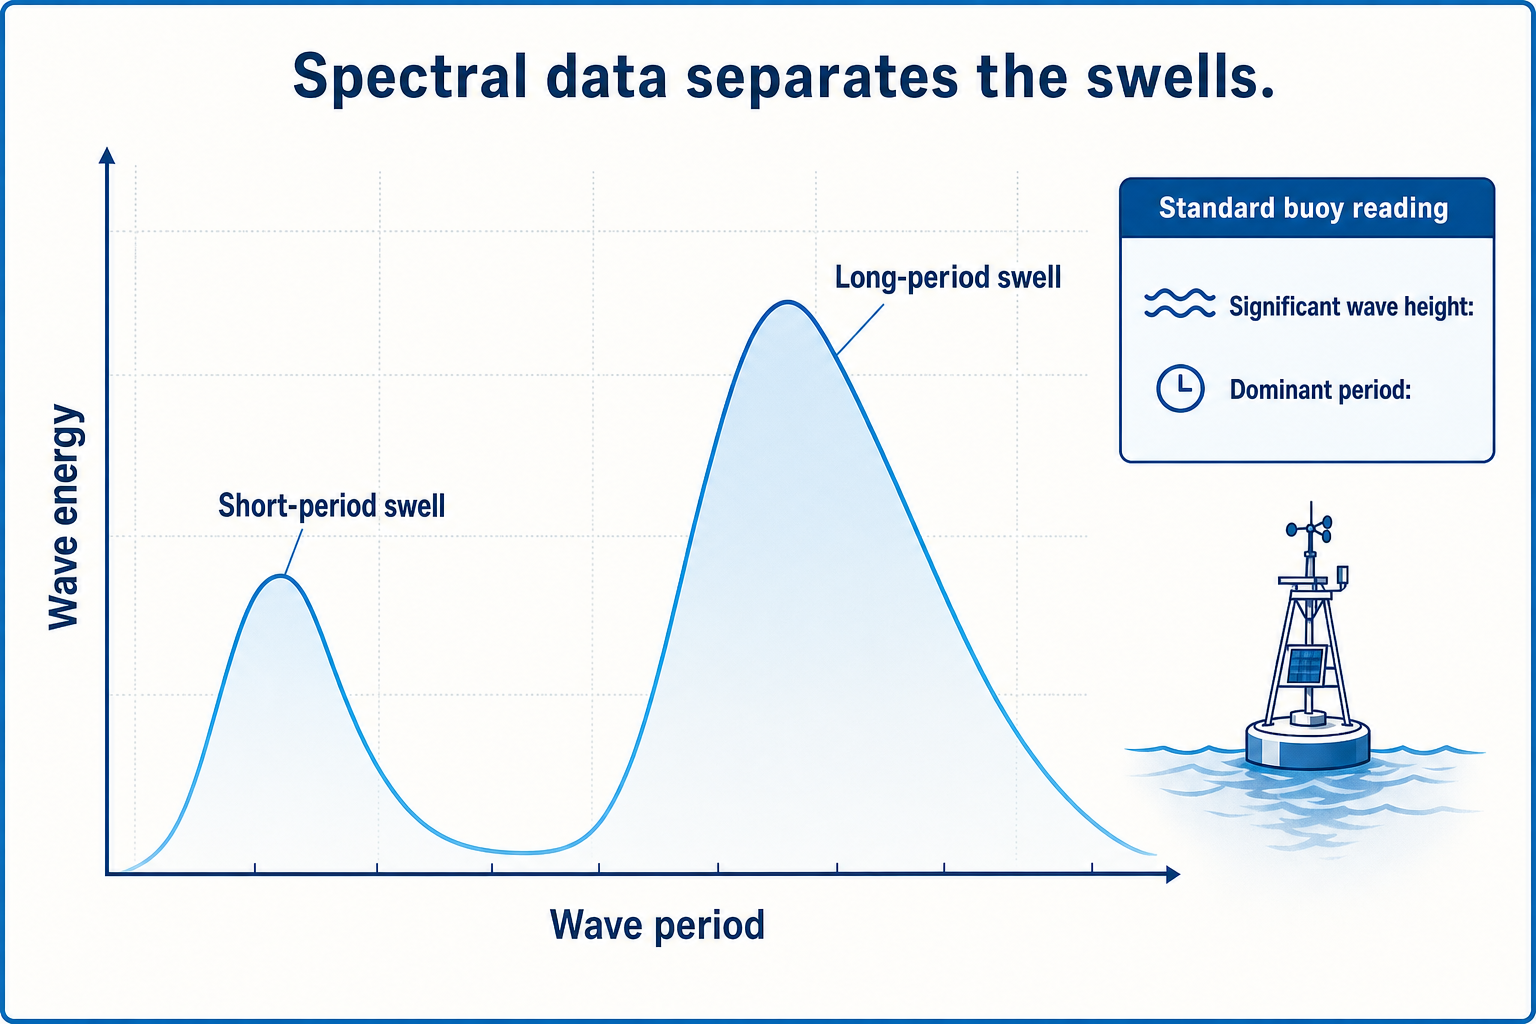
Buoys help confirm whether the forecast is verifying. A standard buoy reading gives significant wave height and dominant period, but spectral data is more useful because it separates different swells present at the same time. A South Pacific pulse may appear as a small long-period signal beneath local wind swell before it fills in at the coast. Watching that signal grow over several readings is a reliable sign that the swell is on its way. For staying updated on sea conditions remotely, a NOAA weather alert radio can deliver marine forecasts and storm updates directly to you without needing a data connection.
Factors That Shape South Pacific Wave Quality
Distance from the Storm
Distant storms tend to create cleaner, more organized swell trains because the waves sort themselves by period as they travel. Faster, longer-period waves pull ahead of the pack, leaving behind the choppier short-period energy closer to the source. This is why Tahiti, Hawaii, and California can receive beautifully lined-up sets from storms that were chaotic seas just days earlier.
Bathymetry and Coastal Shape
Underwater contours can focus or disperse swell significantly. Submarine canyons, outer reefs, and broad continental shelves all change the final surf size at the shore. Long-period South Pacific swell refracts strongly as it shallows up, which is why the best breaks are often those with ideal underwater geometry for a specific narrow swell direction. A break that works perfectly on a 200-degree SSW swell may barely respond to a 180-degree south swell, even if both are the same size offshore.
Local Wind and Surface Conditions
A perfect South Pacific groundswell can still look poor under bad local wind. Many of the best sessions happen when distant swell arrives under stable high-pressure conditions, light offshore morning wind, or consistent trade flow. Checking local wind forecasts alongside swell forecasts is just as important as reading the storm correctly.
Swell Period and Break Type
Very long-period swell can be exceptional at reefs and points but may close out open beachbreaks or be too powerful to ride in shallow water. Medium-period swell is often more manageable and can create peaky, consistent surf over a wider range of spots. The ideal period depends entirely on the break and how it handles energy.
South Pacific swell forecasting is part meteorology and part geography. The storm must produce strong enough wind, maintain sufficient duration, and align its fetch along the right great-circle path toward your coast. Then the swell must survive the crossing, avoid island shadows, and arrive with local conditions that allow the waves to show their shape. Once you understand how deep lows, seasonal storm tracks, and swell direction interact across this enormous ocean, the weather map stops looking like noise and starts clearly showing you where the next run of waves will come from.