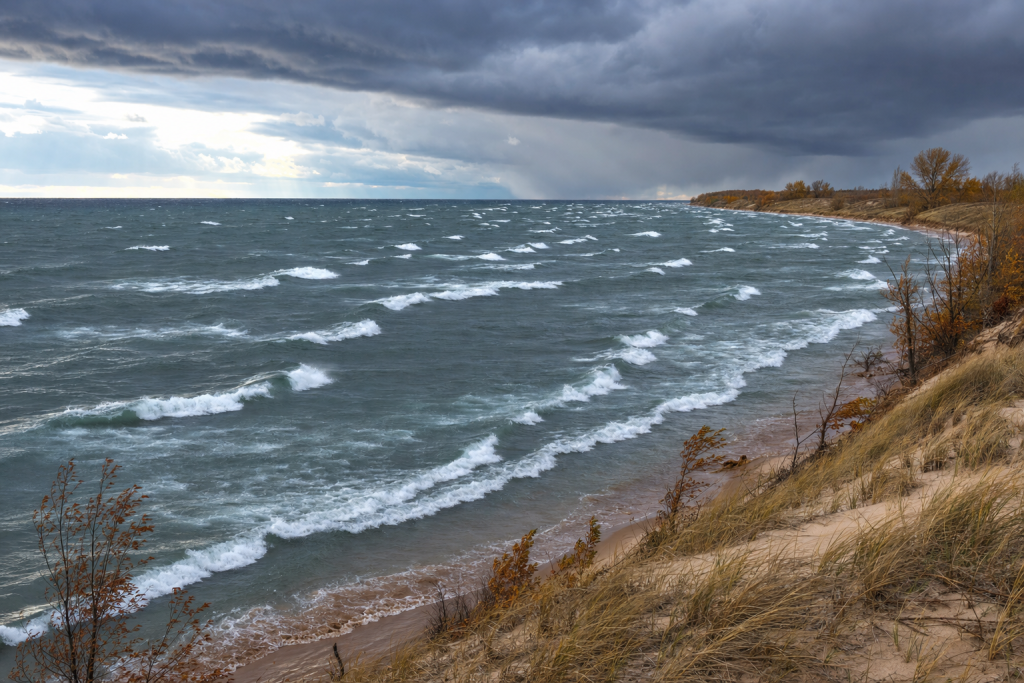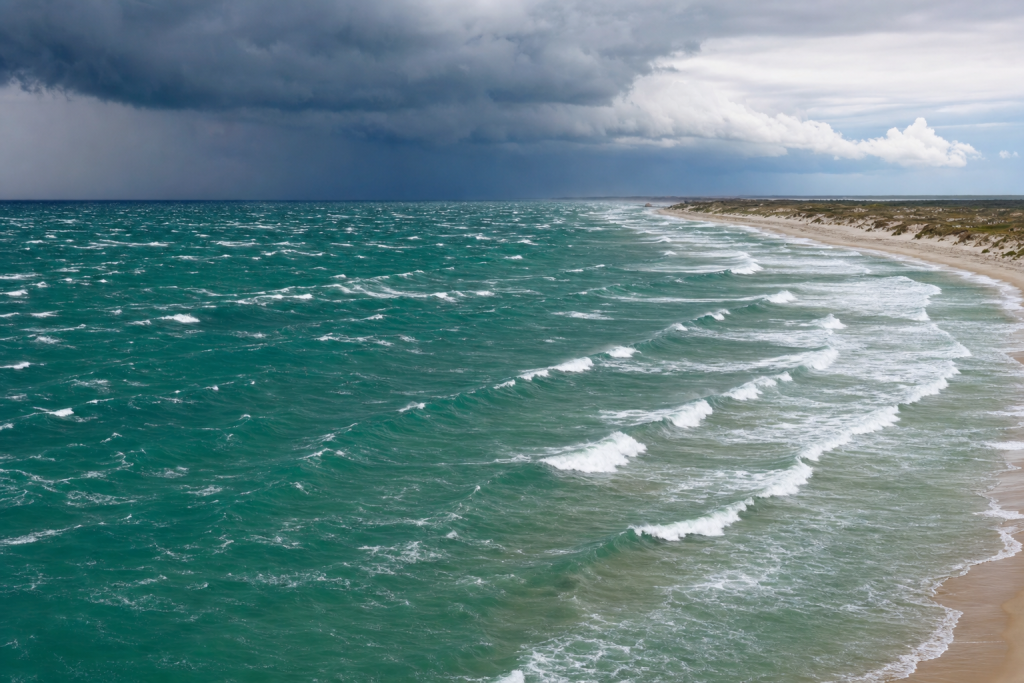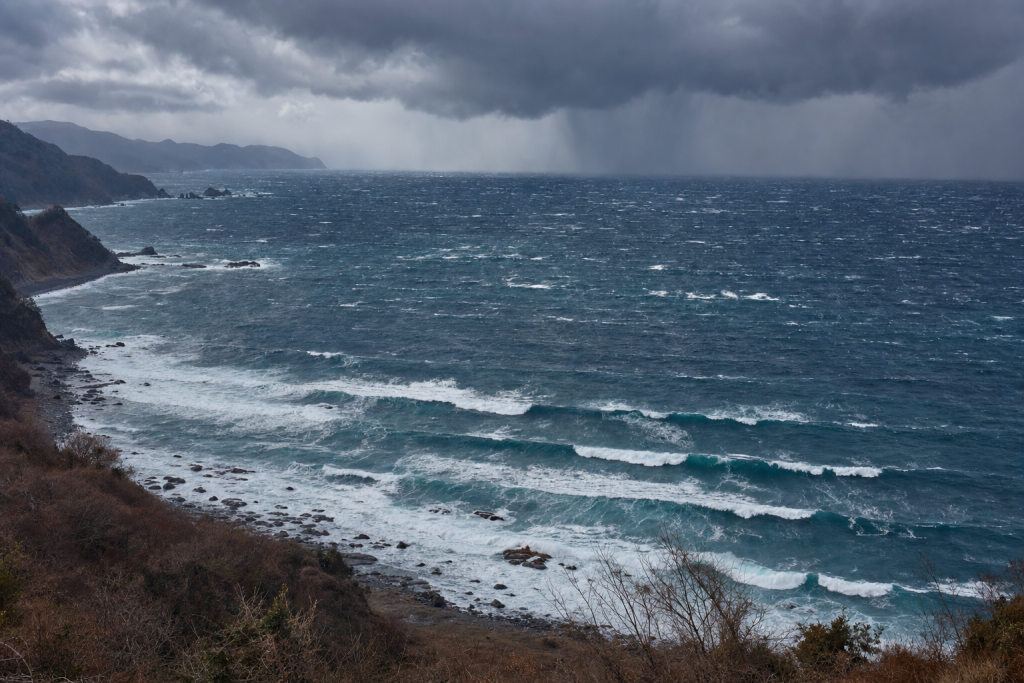
The Tasman Sea is one of the most productive swell engines for the east coast of Australia and the west coast of New Zealand. It can produce everything from short, peaky summer windswell to powerful long-period groundswell from deep lows south of Tasmania. Understanding how waves are generated here is one of the most useful skills in surf forecasting, because the same weather map can mean clean lines at one beach, unruly storm surf at another, and barely a ripple somewhere sheltered by headlands. If you want to go deeper on the science behind it all, this surf forecasting guide is a solid place to start, and keeping a surf journal to track what you observe can sharpen your pattern recognition quickly.
How Tasman Sea waves are generated
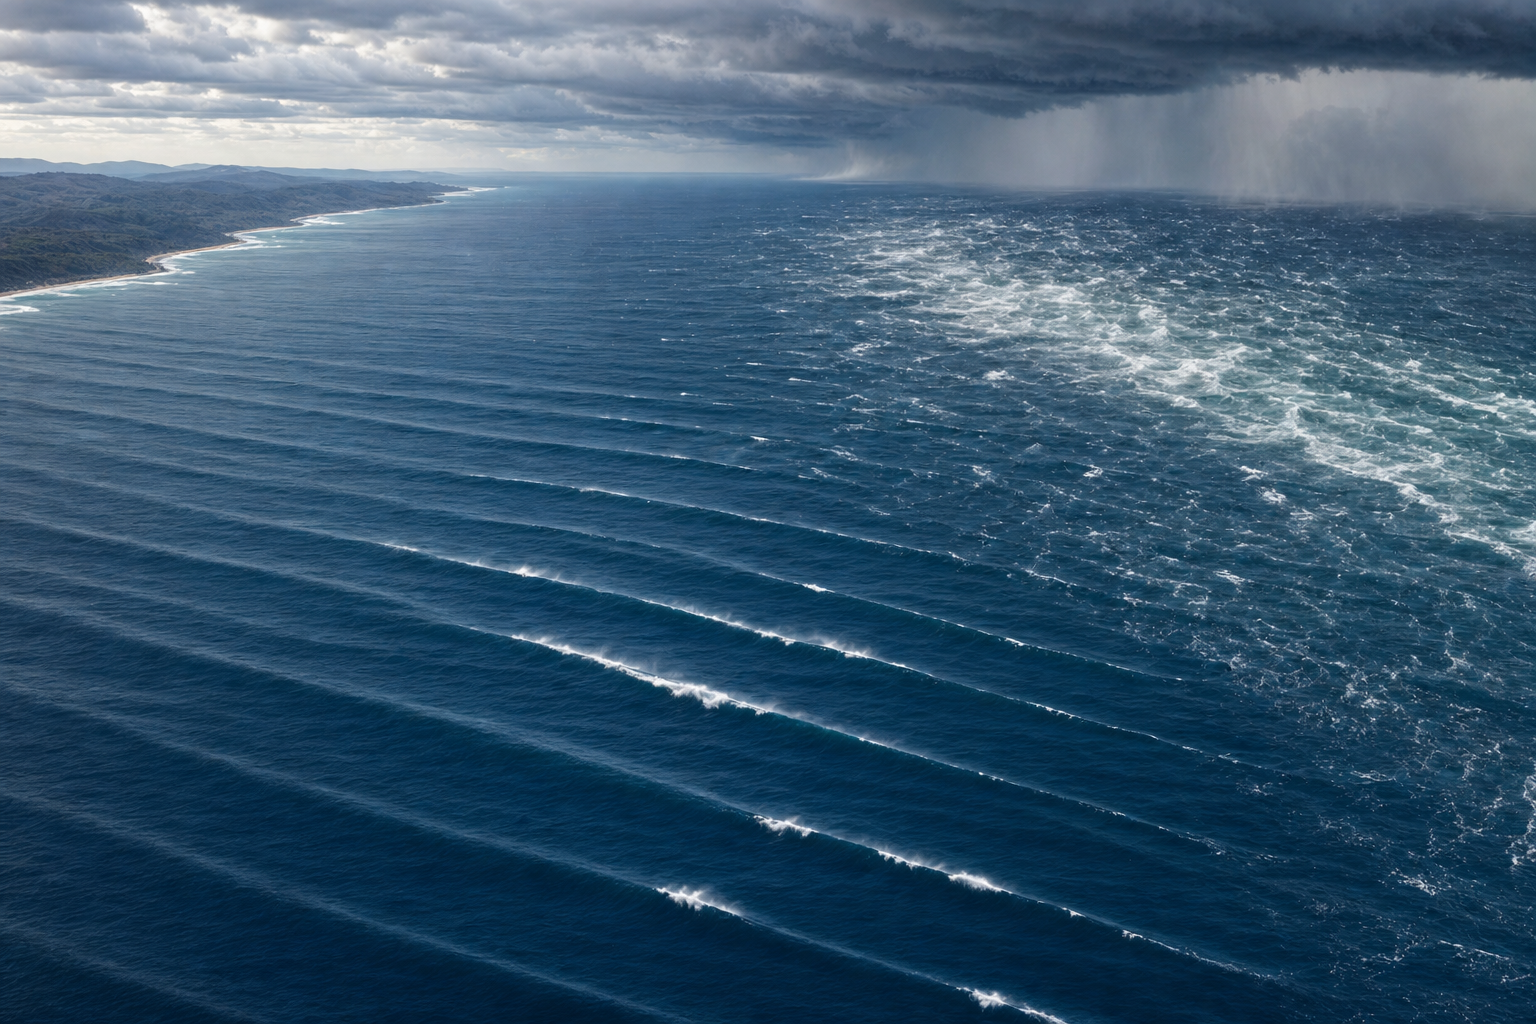
Waves in the Tasman Sea are generated when wind transfers energy into the ocean surface. At first, small ripples form. If the wind keeps blowing strongly enough over a large enough area, those ripples grow into wind waves. As they travel away from the storm, they sort themselves into cleaner, more organized swell. A good oceanography textbook explains this energy transfer process in detail if you want to understand the physics behind it.
The three key ingredients: wind speed, fetch, and duration
Every Tasman Sea swell forecast starts with three questions:
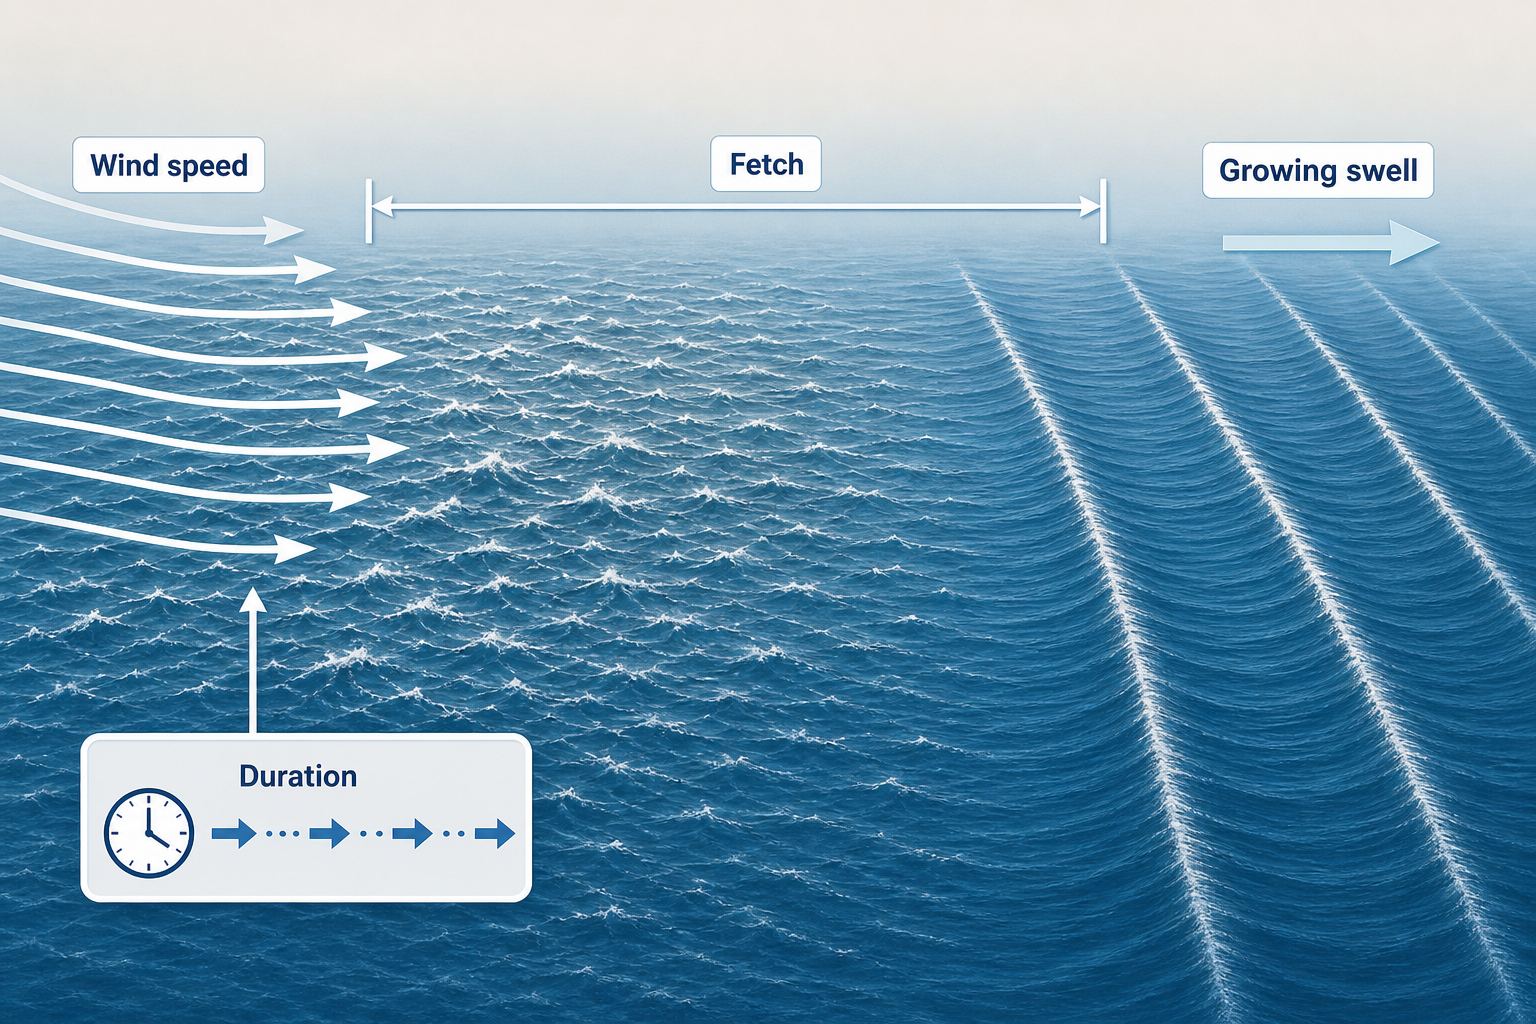
- How strong is the wind? Stronger wind puts more energy into the sea surface and creates larger waves.
- How long is the fetch? Fetch is the stretch of ocean over which the wind blows in roughly the same direction.
- How long does the wind last? A brief gale may create a sharp pulse, while a slow-moving storm can build a much larger swell.
A compact low with 45-knot winds may create a strong but brief pulse if it moves quickly. A broad 25-knot easterly fetch across the northern Tasman may produce smaller waves, but they can last for days because the wind field is long and persistent.
Swell direction and period in the Tasman Sea
Swell direction describes where the swell is coming from. A southerly swell travels from south to north, and an easterly swell travels from east to west. This matters because the Australian east coast is full of headlands, bays, and offshore islands that filter which swell directions actually reach the shore.
Wave period is the time between successive wave crests, and it’s one of the best clues to swell quality:
- 5 to 8 seconds: local windswell, usually weak and messy.
- 8 to 11 seconds: short to mid-period swell, common from trade-wind fetches and nearby lows.
- 12 to 16 seconds: groundswell, often more powerful and better organized.
- 17 seconds and above: long-period swell, usually from distant or very intense storms.
Longer-period waves travel faster. In deep water, swell group speed is roughly 2.8 times the period in kilometres per hour. A 12-second swell travels about 34 kilometres per hour, while a 16-second swell travels about 45 kilometres per hour. This helps forecasters estimate when a new swell will arrive after it appears on offshore buoys.
The Tasman Sea weather engine
The Tasman Sea sits between warm subtropical water to the north and colder Southern Ocean air to the south. That contrast helps create strong pressure systems, especially when upper-level troughs or cold fronts move into the region. Monitoring conditions locally using a wireless weather station can help you track the pressure and temperature shifts that signal incoming swell.
Atmospheric pressure and Tasman Sea swell
On a weather map, the most important feature is not just the central pressure of a low, but the pressure gradient around it. Closely packed isobars mean stronger wind. In the Southern Hemisphere, air flows clockwise around lows and anticlockwise around highs, with surface winds crossing slightly toward lower pressure.
A 1000 hPa low can generate serious surf if it sits next to a 1035 hPa high, because the pressure gradient between them is steep. A deeper low far from any strong high may actually have less useful fetch aimed at the coast. Keeping a marine barometer on hand lets you watch these pressure changes in real time. If you want to get comfortable with weather terminology, a weather reference dictionary is worth having nearby when you’re reading charts.
Temperature, ocean currents, and instability
Temperature doesn’t create surf by itself, but it drives the weather systems that do. The warm East Australian Current supplies heat and moisture along the western Tasman. When colder upper air or a Southern Ocean front moves over this warm water, the atmosphere can become unstable. That instability helps lows deepen, winds strengthen, and rain bands form.
In the southern Tasman, cold fronts and polar lows are powered by strong contrasts between cold Antarctic air and milder mid-latitude air. In the northern Tasman and Coral Sea, tropical moisture can feed cyclones, subtropical lows, and broad easterly fetches.
Major storm types that generate Tasman Sea waves
Southern Tasman lows and cold fronts
Southern Tasman lows are classic generators of south swell for New South Wales, eastern Tasmania, and sometimes southern Queensland when the direction isn’t too steep. They usually form when a cold front or deep low moves through the Southern Ocean, south of Tasmania, or into the lower Tasman Sea.
On a weather map, this setup often shows a deep low east or southeast of Tasmania with tight north-south isobars across the western Tasman. A high over the Australian mainland or the Great Australian Bight may help drive a strong southerly flow up the coast.
| Feature | Typical outcome |
|---|---|
| Swell direction | S to SSE for eastern Australia; W to SW for western New Zealand |
| Typical surf height | 3 to 8 ft at exposed breaks; larger during major lows |
| Typical period | 10 to 16 seconds |
| Wave quality | Often clean on the Australian east coast when winter westerlies blow offshore |
These swells can be very directional. South-facing beaches may be solid while nearby protected corners stay much smaller. Long-period south swell can also close out exposed beach breaks but wrap beautifully into reefs and points when the angle is right.
East Coast Lows
East Coast Lows are among the most powerful surf-producing systems in the Tasman Sea. They typically form near the New South Wales or southern Queensland coast, often when an upper-level trough interacts with a coastal trough over the warm Tasman Sea waters.
On a weather map, an East Coast Low appears as a closed low-pressure system just offshore, often with very tightly packed isobars between the low and a strong high over the southern Tasman or New Zealand. The exact position of the low controls both the swell direction and the local wind. Monitoring marine weather broadcasts with a handheld VHF marine radio is especially useful when these systems develop quickly near the coast.
| Feature | Typical outcome |
|---|---|
| Swell direction | E, SE, or S depending on the low’s position |
| Typical surf height | 4 to 12 ft; occasionally larger at exposed coasts |
| Typical period | 8 to 14 seconds |
| Wave quality | Raw and stormy while the low is close; much better when winds turn offshore |
East Coast Lows often produce a lot of size quickly, but quality depends heavily on timing. The best surf frequently arrives after the peak of the storm, once the low moves away, the swell stays strong, and local winds swing west or southwest.
Tasman highs and easterly trade-wind swell
Not all surf-producing weather is dramatic. A strong high-pressure system over the Tasman Sea or near New Zealand can create a broad easterly or southeasterly fetch across the northern Tasman and Coral Sea. This setup is common in summer and autumn, particularly for Queensland and northern New South Wales. It may not produce the biggest surf, but it can be consistent for several days.
| Feature | Typical outcome |
|---|---|
| Swell direction | E to SE |
| Typical surf height | 2 to 5 ft at exposed breaks |
| Typical period | 8 to 11 seconds |
| Wave quality | Consistent, sometimes wind-affected; good on sheltered points |
On a weather map, look for a broad high with long, evenly spaced isobars feeding easterly winds across the northern Tasman. The best trade swells come from fetches that persist for several days and aim directly at the coast.
Tropical cyclones and ex-tropical lows
Tropical cyclones in the Coral Sea, near New Caledonia, or over the northern Tasman can generate some of the best northeast and east swells for Queensland and northern New South Wales. If the system tracks south, central New South Wales can also receive powerful swell.
The ideal cyclone swell setup isn’t always the strongest storm. A slow-moving system with a broad fetch aimed at the coast is often better than a very intense cyclone that moves too fast or sends swell in the wrong direction.
| Feature | Typical outcome |
|---|---|
| Swell direction | NE, E, or SE depending on the track |
| Typical surf height | 4 to 10 ft; larger in exceptional events |
| Typical period | 10 to 17 seconds |
| Wave quality | Can be excellent when the storm is distant and local winds are light or offshore |
On a chart, cyclones appear as compact, circular lows with very tight isobars. The most useful surf comes from the quadrant where winds are blowing over open water toward the target coastline. A strong high to the south can expand the fetch and make the swell more consistent.
Local northeasterly windswell
During warmer months, a thermal trough over eastern Australia and a high over the Tasman often combine to create afternoon northeasterly winds along the New South Wales coast. These winds generate short-period NE windswell that rises and fades quickly since the fetch is close to shore.
| Feature | Typical outcome |
|---|---|
| Swell direction | NE |
| Typical surf height | 1 to 4 ft |
| Typical period | 5 to 8 seconds |
| Wave quality | Peaky and short-lined; best when the wind eases or turns offshore |
This isn’t classic groundswell, but it can create fun surf at beaches that face northeast, especially during the early morning before the sea breeze fills in.
Seasonal Tasman Sea swell patterns
Summer
Summer is dominated by warm water, sea breezes, subtropical highs, and tropical activity. The northern Tasman and Coral Sea are the main swell sources. Southern Ocean systems tend to track farther south during this time of year, so south swell is less consistent than in winter.
| Dominant sources | Directions | Typical height | Typical period | Quality |
|---|---|---|---|---|
| NE winds, trade fetches, cyclones | NE to E | 1 to 4 ft; cyclone swells larger | 6 to 11 seconds; cyclone swells 12+ | Best with morning light winds or protected points |
Autumn
Autumn is often the most balanced season. The ocean is still warm, tropical systems can still develop, and stronger mid-latitude lows begin reaching the Tasman. Winds are frequently more favourable than in summer, which can mean better surf quality even when the swell isn’t huge.
| Dominant sources | Directions | Typical height | Typical period | Quality |
|---|---|---|---|---|
| Ex-tropical lows, Tasman lows, early south swells | E to SE; sometimes S | 2 to 6 ft; larger during lows | 9 to 15 seconds | Often very good due to cleaner winds and mixed swell sources |
Winter
Winter brings stronger cold fronts, deeper Southern Ocean lows, and more frequent westerly winds along much of the Australian east coast. It’s the key season for south swell, though East Coast Lows can also produce major E or SE events. Measuring wind speed at the beach with a handheld anemometer can help you judge whether conditions are actually offshore or just light onshore.
| Dominant sources | Directions | Typical height | Typical period | Quality |
|---|---|---|---|---|
| Southern Tasman lows, cold fronts, East Coast Lows | S to SSE; sometimes E | 3 to 8 ft at exposed breaks | 10 to 16 seconds | Can be excellent when offshore westerlies groom the swell |
Spring
Spring is changeable. Southern Ocean fronts are still active, but northeasterly winds begin returning. Strong highs can ridge across the Tasman, creating SE swell and persistent onshore flow. The best surf tends to arrive in short windows after fronts pass or wind changes swing through.
| Dominant sources | Directions | Typical height | Typical period | Quality |
|---|---|---|---|---|
| South swells, SE trade fetches, NE windswell | S, SE, or NE | 2 to 5 ft | 7 to 13 seconds | Variable; best in short windows after fronts or wind changes |
What Tasman Sea swell-producing storms look like on a weather map
Learning to read a weather map is essential for self-sufficient surf forecasting. A world atlas can help you orient yourself to the geography of the Tasman region, and a resource like this nautical chart guide is useful for understanding how charts represent ocean features and pressure systems.
Classic south swell map
A classic south swell chart shows a low or frontal system in the southern Tasman, often east or southeast of Tasmania. The key feature is a strong S to SW wind fetch pushing northward through the western Tasman. Isobars are tightly packed, and the fetch is aimed up the New South Wales coast.
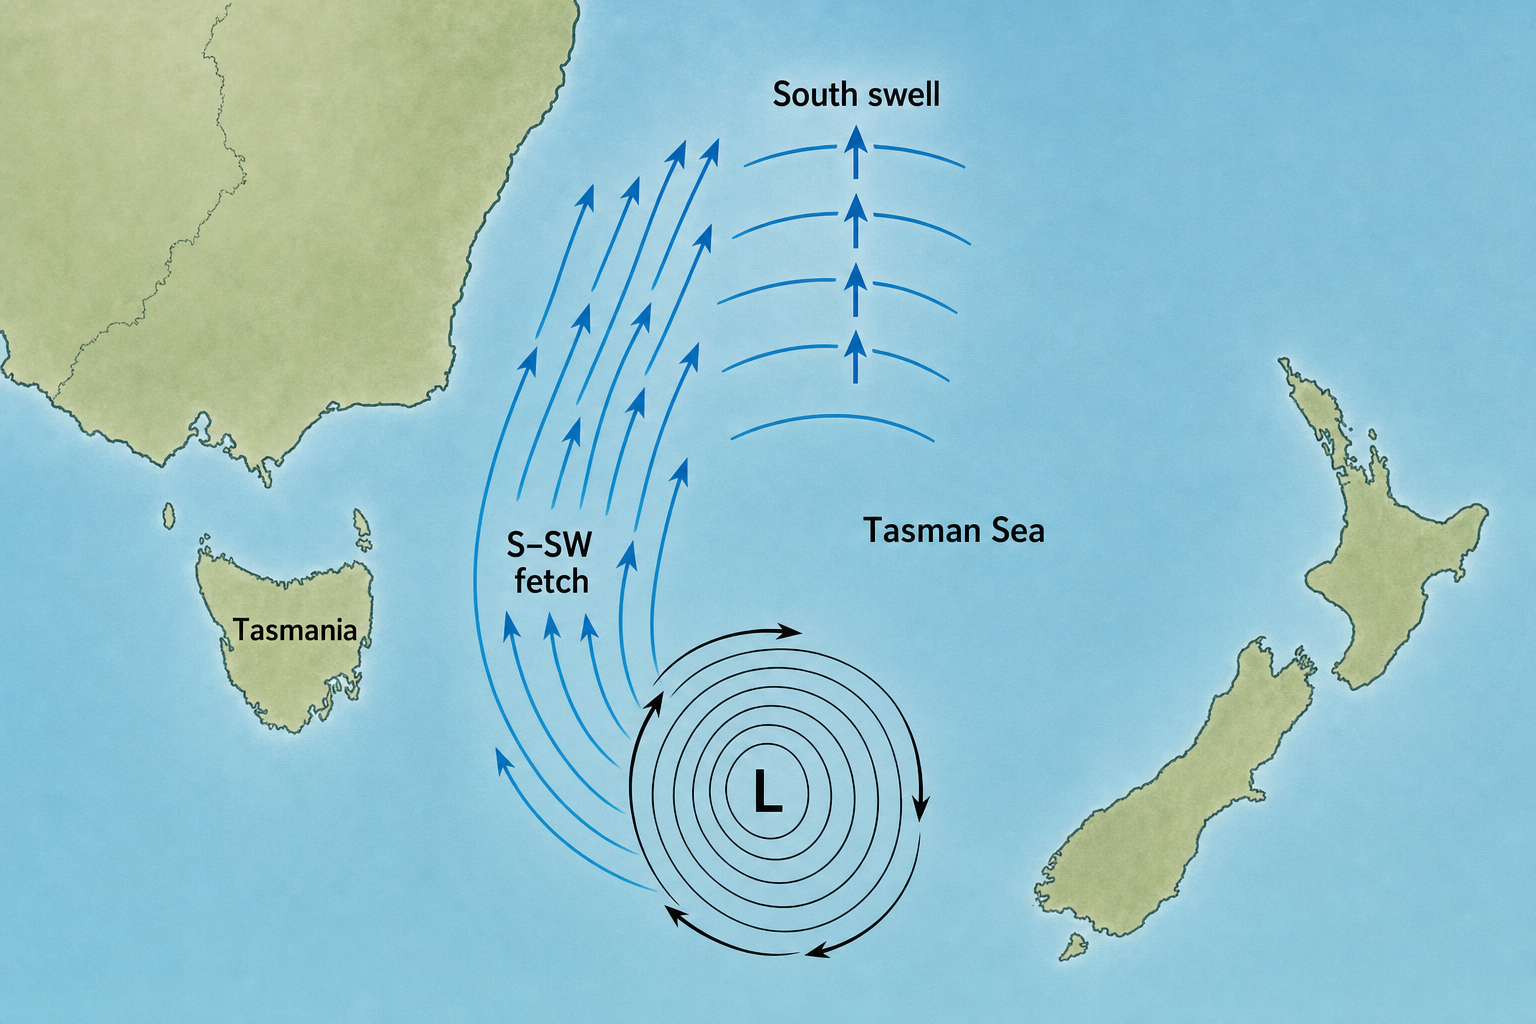
This setup usually produces a fast-rising south swell. If the fetch is close, the swell may be raw and disorganized at first. If the low is farther away, the swell arrives cleaner and more lined up.
Classic East Coast Low map
An East Coast Low map shows a closed low near the coast with tight circular isobars. A strong high to the south or east often helps create a powerful gradient. Depending on the low’s position, winds may blow from the east, southeast, or south over a long stretch of Tasman water.
If the low is too close, local winds can ruin the surf entirely. If it moves away while maintaining a strong fetch, conditions can improve dramatically within a matter of hours.
Classic trade-swell map
A trade-swell map looks less dramatic than a storm chart. Instead of one intense low, you see a broad high-pressure ridge and a long belt of easterly or southeasterly winds across the northern Tasman. The isobars aren’t always tightly packed, but they extend over a large area and persist for days.
This pattern favours consistent mid-period swell, especially for southeast Queensland and northern New South Wales.
Classic cyclone-swell map
A cyclone swell map shows a compact tropical low north or northeast of the target coast. The best setup has the cyclone moving slowly, with one side of its circulation aimed toward the coast. A supporting high to the south can lengthen the fetch and improve swell consistency.
Forecasting cyclone swell requires careful attention to track. A small shift in the cyclone’s direction can move the swell window from excellent to almost useless for a specific stretch of coastline.
How to forecast waves from Tasman Sea storms
Having the right tools makes the forecasting process more reliable. A weather alert radio will keep you updated on rapidly changing marine conditions, and keeping notes on a waterproof notepad while you’re at the beach means you won’t lose your observations to a splash or a rain shower. If you’re working from printed charts in the field, a waterproof map case will protect them from the elements.
Step 1: Know the swell window of the surf spot
Before reading the storm, study the coastline. A south-facing beach in New South Wales may receive a strong south swell directly, while a north-facing point nearby may be partly shadowed by headlands. Southeast Queensland is heavily protected from steep south swell, so it often needs E or ESE energy to come alive properly.
For New Zealand’s west coast, the most important Tasman Sea directions are W, SW, and sometimes NW. The same storm that sends south swell toward Australia may send a completely different energy band toward New Zealand. A coastal navigation chart of your local area can help you visualize which swell directions your spot is actually exposed to.
Step 2: Find the fetch aimed at the coast
Look for areas of wind blowing across open water toward the swell window. A useful fetch needs enough wind strength and enough distance to build waves before the wind changes direction or hits land.
As a rough guide:
- 15 to 25 knots: small windswell if the fetch is local.
- 20 to 30 knots: useful trade swell if the fetch is broad and persistent.
- 30 to 45 knots: solid swell from lows or strong fronts.
- 45 knots and above: large swell potential if the fetch is well aimed.
Step 3: Estimate size and period
Nearby fetches produce shorter-period swell because the waves have less time and distance to organize. Distant or slow-moving storms create longer-period swell, especially when gale-force winds persist for more than 24 hours.
Use the storm type as a starting point. NE windswell is usually 5 to 8 seconds. Trade swell is commonly 8 to 11 seconds. East Coast Lows often produce 9 to 14 seconds. Strong Southern Ocean and southern Tasman lows can reach 14 to 18 seconds.
Step 4: Calculate arrival time
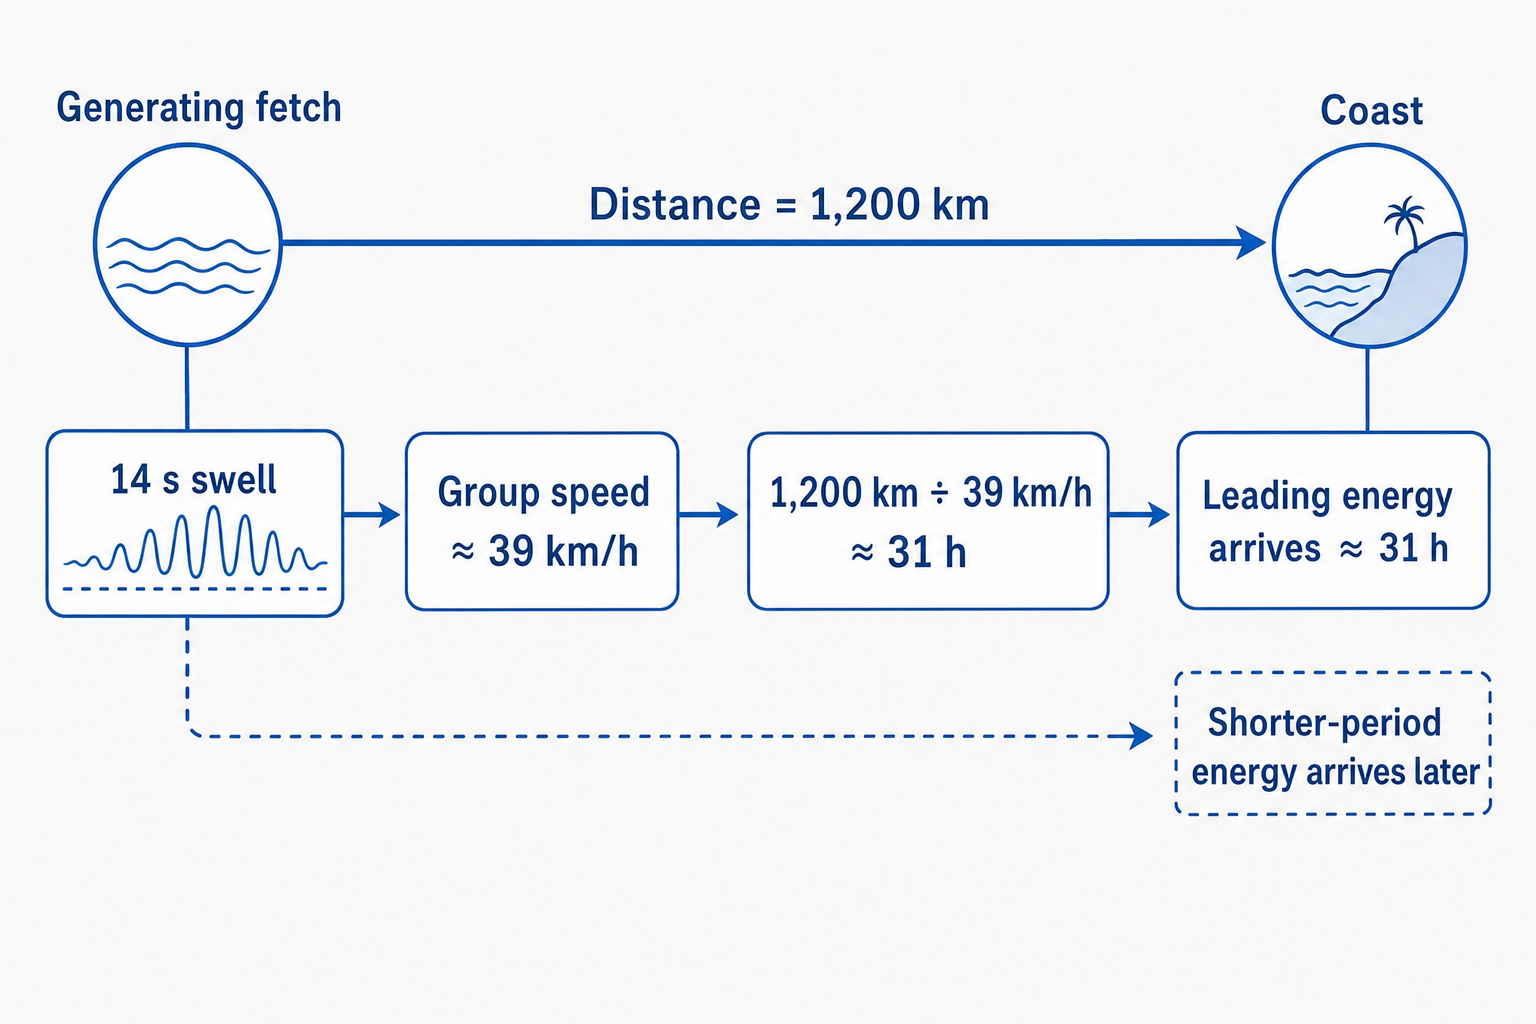
Once the swell is generated, estimate travel time using deep-water group speed. A simple formula is:
Travel speed in km/h ≈ 2.8 × wave period in seconds
For example, a 14-second swell travels about 39 km/h. If the generating fetch is 1,200 km from the coast, the leading energy may arrive in roughly 31 hours. Shorter-period energy within the same swell arrives later, so the first pulse is often the most powerful and the surf tends to fill in from there.
Step 5: Watch the buoys
Offshore wave buoys confirm what the weather map suggests. A rising long-period signal often means the first groundswell lines are arriving. A sharp increase in short-period energy usually points to local windswell or nearby storm surf rather than organized groundswell.
Direction matters as much as height. A buoy may show a significant south swell, but a beach that needs easterly energy could still remain small. Spectral buoy data is especially useful because it separates different swell trains arriving at the same time from different directions.
Step 6: Adjust for local winds and bathymetry
Swell creates the raw material, but local conditions decide the quality. Offshore winds groom the wave face. Onshore winds add bump and chop. Light winds often allow the swell to show its true shape without interference.
Bathymetry also matters. Long-period swell refracts more strongly around headlands and focuses energy over reefs. Short-period windswell is less organized and breaks across a broader area without much focus. This is why two breaks only a few kilometres apart can look completely different under the same Tasman Sea swell.
Forecasting Tasman Sea waves is ultimately about connecting the atmosphere to the surf zone. Read the pressure pattern, identify the fetch, estimate the swell direction and period, then adjust for coastline exposure and local wind. With practice, a weather map stops looking like a jumble of isobars and starts looking like a map of future surf. The Tasman Sea rewards that kind of attention because its storms are varied, fast-changing, and capable of producing everything from playful beach-break peaks to powerful groundswell lines on the same coastline within the same week.